| Red | Green | Blue | |
| z | 17.64 | ||
| znorm | Inf | ||
| sky | -Inf | -Inf | -Inf |
| S/N | 29.4 | 48.4 | 51.1 |
| S/N(c) | 0.0 | 0.0 | 0.0 |
| SN(E/C) |
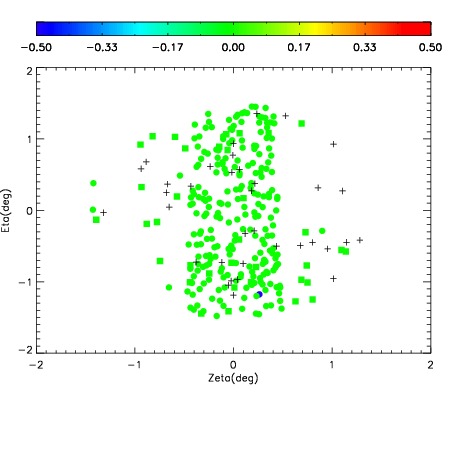
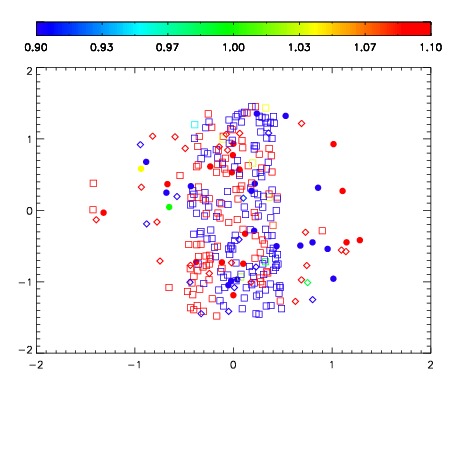


| Frame | Nreads | Zeropoints | Mag plots | Spatial mag deviation | Spatial sky 16325A emission deviations (filled: sky, open: star) | Spatial sky continuum emission | Spatial sky telluric CO2 absorption deviations (filled: H < 10) | |||||||||||||||||||||||
| 0 | 0 |
|
|
|
|
|
|
| IPAIR | NAME | SHIFT | NEWSHIFT | S/N | NAME | SHIFT | NEWSHIFT | S/N |
| 0 | 06920032 | 0.500084 | 0.00000 | 19.1764 | 06920029 | 0.00809518 | 0.491989 | 19.1454 |
| 1 | 06920027 | 0.496877 | 0.00320697 | 19.2002 | 06920030 | 0.000556022 | 0.499528 | 19.1674 |
| 2 | 06920028 | 0.497366 | 0.00271797 | 19.1564 | 06920026 | 0.00000 | 0.500084 | 19.1416 |
| 3 | 06920031 | 0.499737 | 0.000346988 | 19.1513 | 06920033 | 0.00573471 | 0.494349 | 19.1368 |