| Red | Green | Blue | |
| z | 17.64 | ||
| znorm | Inf | ||
| sky | -Inf | -Inf | -Inf |
| S/N | 28.1 | 46.8 | 50.3 |
| S/N(c) | 0.0 | 0.0 | 0.0 |
| SN(E/C) |
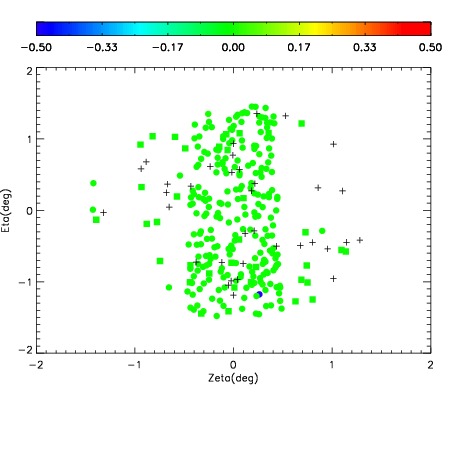


| Frame | Nreads | Zeropoints | Mag plots | Spatial mag deviation | Spatial sky 16325A emission deviations (filled: sky, open: star) | Spatial sky continuum emission | Spatial sky telluric CO2 absorption deviations (filled: H < 10) | |||||||||||||||||||||||
| 0 | 0 |
|
|
|
|
|
|
| IPAIR | NAME | SHIFT | NEWSHIFT | S/N | NAME | SHIFT | NEWSHIFT | S/N |
| 0 | 09970045 | 0.519209 | 0.00000 | 19.1025 | 09970048 | 0.00302464 | 0.516184 | 19.0785 |
| 1 | 09970050 | 0.516068 | 0.00314105 | 19.1609 | 09970051 | -0.00113057 | 0.520340 | 19.1338 |
| 2 | 09970046 | 0.518848 | 0.000361025 | 19.1217 | 09970047 | 0.00349894 | 0.515710 | 19.1056 |
| 3 | 09970049 | 0.516045 | 0.00316405 | 19.0980 | 09970044 | 0.00000 | 0.519209 | 19.0547 |