| Red | Green | Blue | |
| z | 17.64 | ||
| znorm | Inf | ||
| sky | -Inf | -Inf | -Inf |
| S/N | 14.4 | 26.6 | 28.8 |
| S/N(c) | 0.0 | 0.0 | 0.0 |
| SN(E/C) |
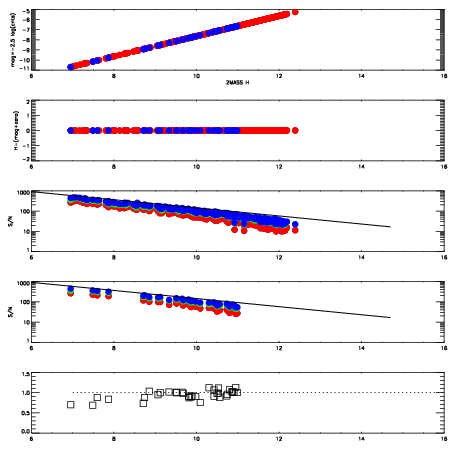
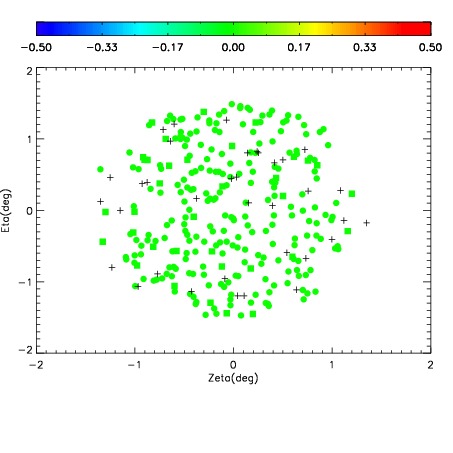
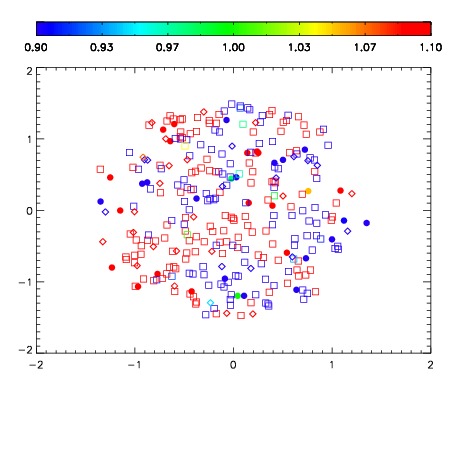
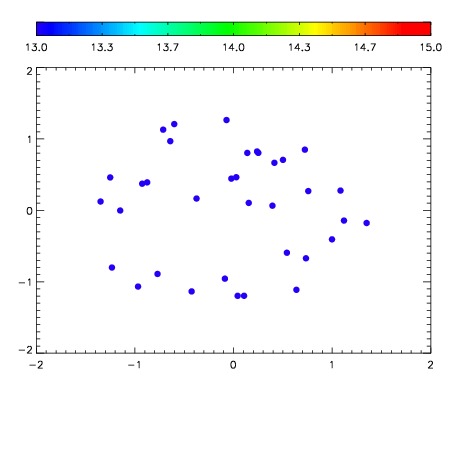

| Frame | Nreads | Zeropoints | Mag plots | Spatial mag deviation | Spatial sky 16325A emission deviations (filled: sky, open: star) | Spatial sky continuum emission | Spatial sky telluric CO2 absorption deviations (filled: H < 10) | |||||||||||||||||||||||
| 0 | 0 |
|
|
|
|
|
|
| IPAIR | NAME | SHIFT | NEWSHIFT | S/N | NAME | SHIFT | NEWSHIFT | S/N |
| 0 | 06900024 | 0.494992 | 0.00000 | 17.9376 | 06900029 | 0.00905548 | 0.485937 | 17.7454 |
| 1 | 06900023 | 0.494794 | 0.000197977 | 18.4302 | 06900026 | 0.00138965 | 0.493602 | 18.5046 |
| 2 | 06900028 | 0.494564 | 0.000427991 | 18.2110 | 06900030 | 0.00570894 | 0.489283 | 17.9586 |
| 3 | 06900027 | 0.493903 | 0.00108898 | 17.6467 | 06900022 | 0.00000 | 0.494992 | 17.7437 |
| 4 | 06900031 | 0.493417 | 0.00157499 | 17.6113 | 06900025 | 0.000468526 | 0.494523 | 17.3951 |
| 5 | 06900032 | 0.493636 | 0.00135598 | 17.6002 | 06900033 | 0.00593345 | 0.489059 | 16.9085 |