| Red | Green | Blue | |
| z | 17.64 | ||
| znorm | Inf | ||
| sky | -Inf | -Inf | -NaN |
| S/N | 28.4 | 47.2 | 49.5 |
| S/N(c) | 0.0 | 0.0 | 0.0 |
| SN(E/C) |
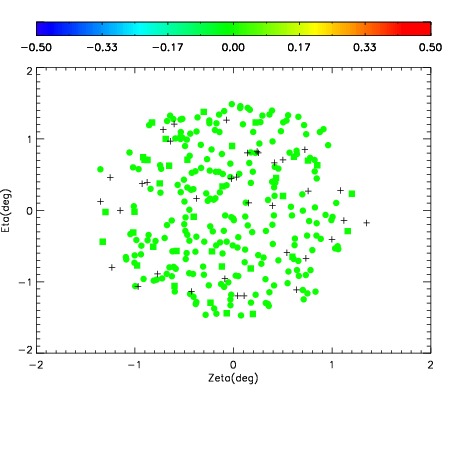

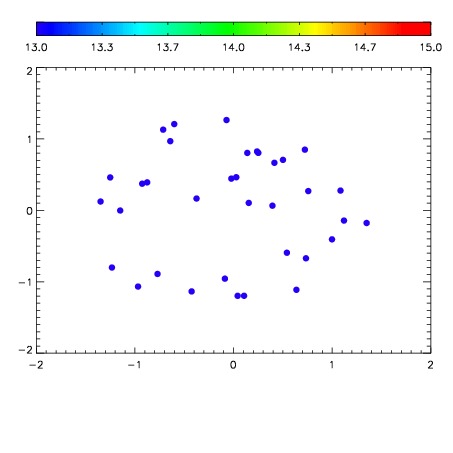

| Frame | Nreads | Zeropoints | Mag plots | Spatial mag deviation | Spatial sky 16325A emission deviations (filled: sky, open: star) | Spatial sky continuum emission | Spatial sky telluric CO2 absorption deviations (filled: H < 10) | |||||||||||||||||||||||
| 0 | 0 |
|
|
|
|
|
|
| IPAIR | NAME | SHIFT | NEWSHIFT | S/N | NAME | SHIFT | NEWSHIFT | S/N |
| 0 | 06940032 | 0.496892 | 0.00000 | 19.1615 | 06940030 | 0.00284653 | 0.494045 | 19.1285 |
| 1 | 06940031 | 0.496572 | 0.000320017 | 19.1625 | 06940033 | 0.00552464 | 0.491367 | 19.1772 |
| 2 | 06940028 | 0.496633 | 0.000259012 | 19.1142 | 06940029 | 0.00126533 | 0.495627 | 19.1175 |
| 3 | 06940027 | 0.496108 | 0.000784010 | 19.0989 | 06940026 | 0.00000 | 0.496892 | 19.1076 |