| Red | Green | Blue | |
| z | 17.64 | ||
| znorm | Inf | ||
| sky | -Inf | -Inf | -Inf |
| S/N | 23.5 | 40.6 | 42.8 |
| S/N(c) | 0.0 | 0.0 | 0.0 |
| SN(E/C) |
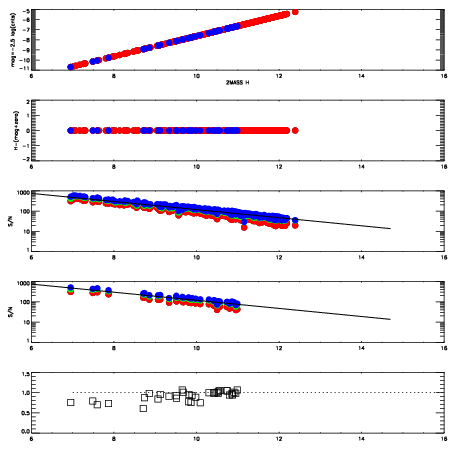
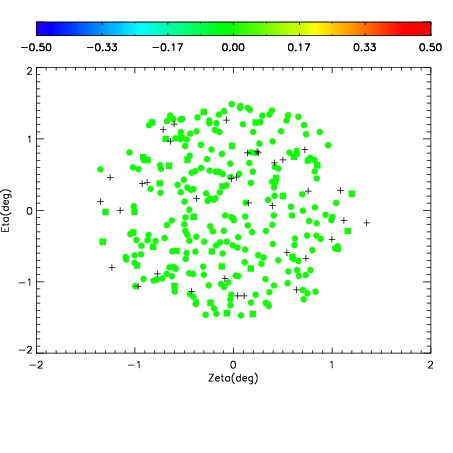
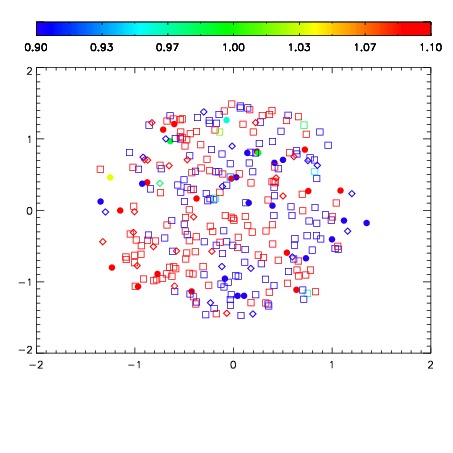


| Frame | Nreads | Zeropoints | Mag plots | Spatial mag deviation | Spatial sky 16325A emission deviations (filled: sky, open: star) | Spatial sky continuum emission | Spatial sky telluric CO2 absorption deviations (filled: H < 10) | |||||||||||||||||||||||
| 0 | 0 |
|
|
|
|
|
|
| IPAIR | NAME | SHIFT | NEWSHIFT | S/N | NAME | SHIFT | NEWSHIFT | S/N |
| 0 | 07200013 | 0.472475 | 0.00000 | 18.7153 | 07200015 | 0.000378934 | 0.472096 | 18.8379 |
| 1 | 07200016 | 0.471668 | 0.000806987 | 18.9412 | 07200018 | -0.000717625 | 0.473193 | 18.9046 |
| 2 | 07200017 | 0.471858 | 0.000616997 | 18.7423 | 07200011 | 0.00000 | 0.472475 | 18.8897 |
| 3 | 07200012 | 0.472353 | 0.000121981 | 18.6527 | 07200014 | 0.000295020 | 0.472180 | 18.8343 |