| Red | Green | Blue | |
| z | 17.64 | ||
| znorm | Inf | ||
| sky | -Inf | -Inf | -Inf |
| S/N | 21.3 | 36.4 | 40.3 |
| S/N(c) | 0.0 | 0.0 | 0.0 |
| SN(E/C) |

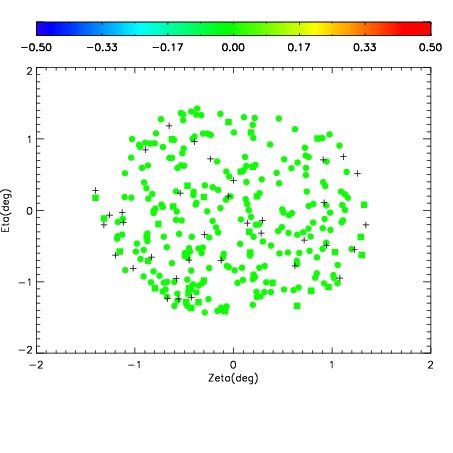

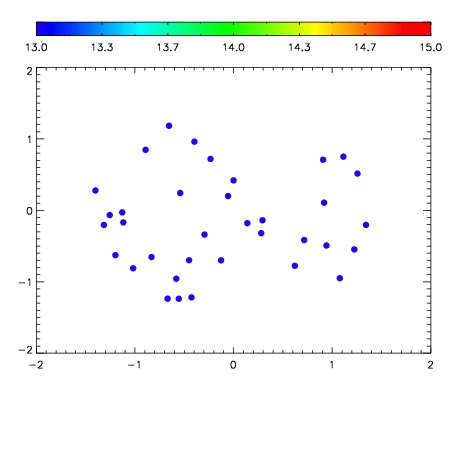

| Frame | Nreads | Zeropoints | Mag plots | Spatial mag deviation | Spatial sky 16325A emission deviations (filled: sky, open: star) | Spatial sky continuum emission | Spatial sky telluric CO2 absorption deviations (filled: H < 10) | |||||||||||||||||||||||
| 0 | 0 |
|
|
|
|
|
|
| IPAIR | NAME | SHIFT | NEWSHIFT | S/N | NAME | SHIFT | NEWSHIFT | S/N |
| 0 | 07540032 | 0.474992 | 0.00000 | 18.8462 | 07540029 | 0.00182193 | 0.473170 | 18.9340 |
| 1 | 07540031 | 0.474784 | 0.000208020 | 18.9757 | 07540030 | -0.00183546 | 0.476827 | 18.9789 |
| 2 | 07540028 | 0.473107 | 0.00188500 | 18.5889 | 07540033 | 0.00127696 | 0.473715 | 18.8781 |
| 3 | 07540027 | 0.471386 | 0.00360602 | 18.3218 | 07540026 | 0.00000 | 0.474992 | 18.4811 |