| Red | Green | Blue | |
| z | 17.64 | ||
| znorm | Inf | ||
| sky | -NaN | -Inf | -Inf |
| S/N | 29.1 | 47.6 | 52.6 |
| S/N(c) | 0.0 | 0.0 | 0.0 |
| SN(E/C) |
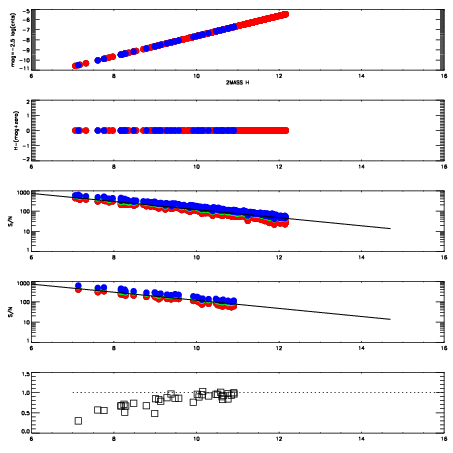


| Frame | Nreads | Zeropoints | Mag plots | Spatial mag deviation | Spatial sky 16325A emission deviations (filled: sky, open: star) | Spatial sky continuum emission | Spatial sky telluric CO2 absorption deviations (filled: H < 10) | |||||||||||||||||||||||
| 0 | 0 |
|
|
|
|
|
|
| IPAIR | NAME | SHIFT | NEWSHIFT | S/N | NAME | SHIFT | NEWSHIFT | S/N |
| 0 | 09980088 | 0.521302 | 0.00000 | 19.2002 | 09980089 | 0.00235988 | 0.518942 | 19.2029 |
| 1 | 09980092 | 0.519479 | 0.00182301 | 19.1851 | 09980093 | 0.00231818 | 0.518984 | 19.1802 |
| 2 | 09980087 | 0.520741 | 0.000560999 | 19.1741 | 09980086 | 0.00000 | 0.521302 | 19.1763 |
| 3 | 09980091 | 0.520491 | 0.000810981 | 19.0624 | 09980090 | 0.00202823 | 0.519274 | 19.1487 |