| Red | Green | Blue | |
| z | 17.64 | ||
| znorm | Inf | ||
| sky | -Inf | -Inf | -Inf |
| S/N | 26.7 | 46.1 | 49.2 |
| S/N(c) | 0.0 | 0.0 | 0.0 |
| SN(E/C) |
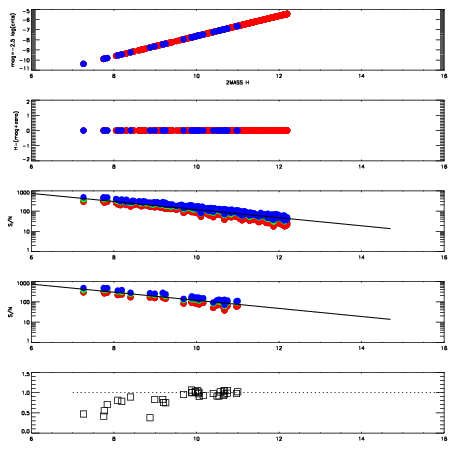

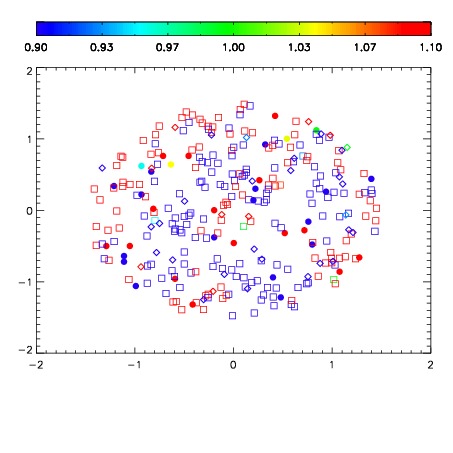


| Frame | Nreads | Zeropoints | Mag plots | Spatial mag deviation | Spatial sky 16325A emission deviations (filled: sky, open: star) | Spatial sky continuum emission | Spatial sky telluric CO2 absorption deviations (filled: H < 10) | |||||||||||||||||||||||
| 0 | 0 |
|
|
|
|
|
|
| IPAIR | NAME | SHIFT | NEWSHIFT | S/N | NAME | SHIFT | NEWSHIFT | S/N |
| 0 | 10210102 | 0.492684 | 0.00000 | 19.0934 | 10210096 | 0.00000 | 0.492684 | 19.0843 |
| 1 | 10210097 | 0.490049 | 0.00263500 | 19.1094 | 10210100 | 0.00258704 | 0.490097 | 19.0941 |
| 2 | 10210101 | 0.492343 | 0.000340998 | 19.0704 | 10210103 | 0.00578560 | 0.486898 | 19.0568 |
| 3 | 10210098 | 0.490907 | 0.00177699 | 19.0694 | 10210099 | 0.00251537 | 0.490169 | 19.0377 |