| Red | Green | Blue | |
| z | 17.64 | ||
| znorm | Inf | ||
| sky | -Inf | -NaN | -Inf |
| S/N | 32.5 | 54.4 | 60.9 |
| S/N(c) | 0.0 | 0.0 | 0.0 |
| SN(E/C) |
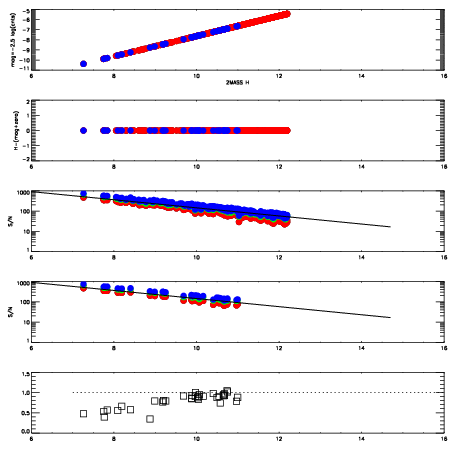
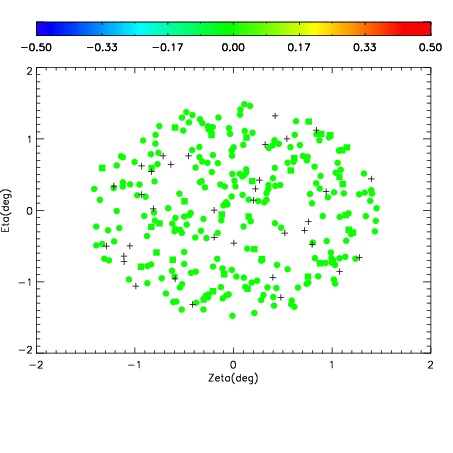

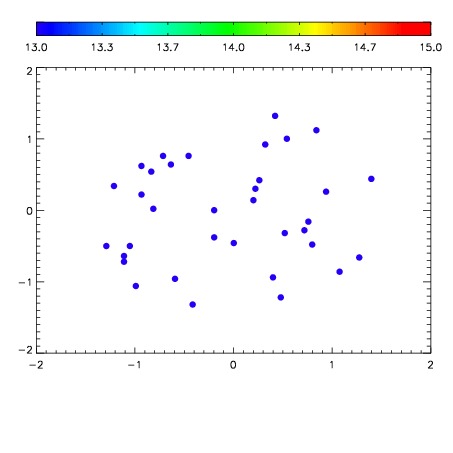

| Frame | Nreads | Zeropoints | Mag plots | Spatial mag deviation | Spatial sky 16325A emission deviations (filled: sky, open: star) | Spatial sky continuum emission | Spatial sky telluric CO2 absorption deviations (filled: H < 10) | |||||||||||||||||||||||
| 0 | 0 |
|
|
|
|
|
|
| IPAIR | NAME | SHIFT | NEWSHIFT | S/N | NAME | SHIFT | NEWSHIFT | S/N |
| 0 | 10260103 | 0.494875 | 0.00000 | 19.0179 | 10260101 | 0.00218963 | 0.492685 | 19.0743 |
| 1 | 10260099 | 0.494178 | 0.000697017 | 19.1381 | 10260100 | 0.00221349 | 0.492662 | 19.1524 |
| 2 | 10260098 | 0.494424 | 0.000451028 | 19.1237 | 10260097 | 0.00163255 | 0.493242 | 19.1336 |
| 3 | 10260094 | 0.494574 | 0.000301003 | 19.0536 | 10260096 | 0.00150787 | 0.493367 | 19.1148 |
| 4 | 10260095 | 0.494713 | 0.000162005 | 19.0125 | 10260093 | 0.00000 | 0.494875 | 18.8716 |
| 5 | 10260102 | 0.494670 | 0.000205010 | 19.0038 | 10260104 | 0.00261587 | 0.492259 | 18.8377 |