| Red | Green | Blue | |
| z | 17.64 | ||
| znorm | Inf | ||
| sky | -Inf | -Inf | -NaN |
| S/N | 20.2 | 36.4 | 38.3 |
| S/N(c) | 0.0 | 0.0 | 0.0 |
| SN(E/C) |
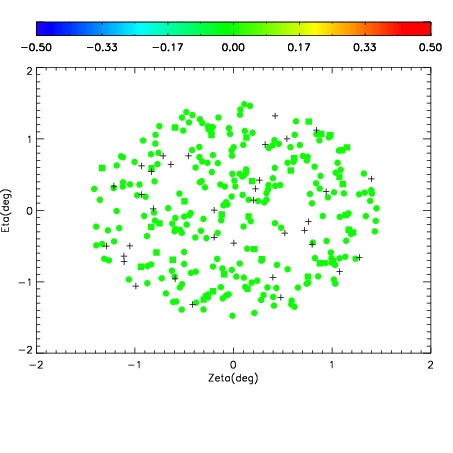
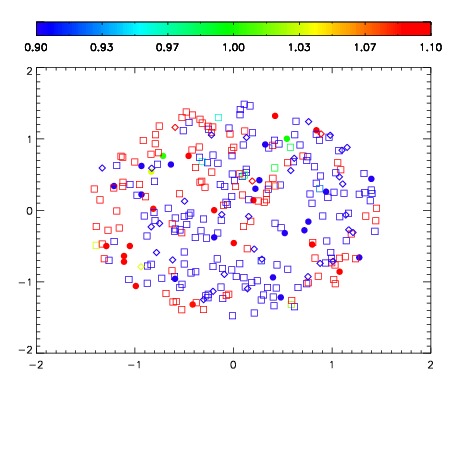
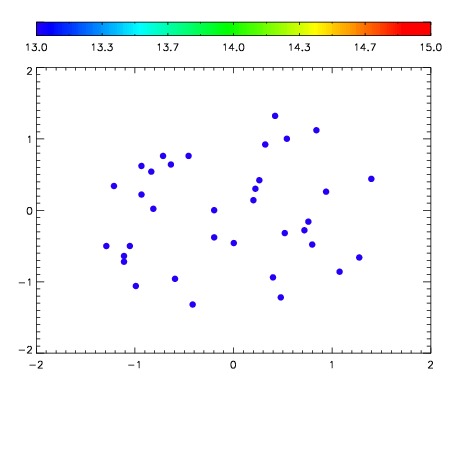

| Frame | Nreads | Zeropoints | Mag plots | Spatial mag deviation | Spatial sky 16325A emission deviations (filled: sky, open: star) | Spatial sky continuum emission | Spatial sky telluric CO2 absorption deviations (filled: H < 10) | |||||||||||||||||||||||
| 0 | 0 |
|
|
|
|
|
|
| IPAIR | NAME | SHIFT | NEWSHIFT | S/N | NAME | SHIFT | NEWSHIFT | S/N |
| 0 | 10610044 | 0.506143 | 0.00000 | 18.4710 | 10610046 | 0.00280718 | 0.503336 | 18.3311 |
| 1 | 10610041 | 0.505921 | 0.000221968 | 18.8790 | 10610042 | 0.00222249 | 0.503920 | 18.8564 |
| 2 | 10610040 | 0.505505 | 0.000637949 | 18.4983 | 10610043 | 0.00156211 | 0.504581 | 18.7025 |
| 3 | 10610045 | 0.506113 | 2.99811e-05 | 18.4790 | 10610039 | 0.00000 | 0.506143 | 18.4610 |