| Red | Green | Blue | |
| z | 17.64 | ||
| znorm | Inf | ||
| sky | -NaN | -Inf | -Inf |
| S/N | 27.0 | 48.3 | 50.9 |
| S/N(c) | 0.0 | 0.0 | 0.0 |
| SN(E/C) |
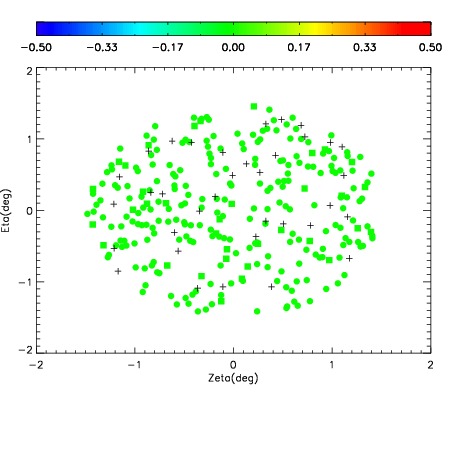

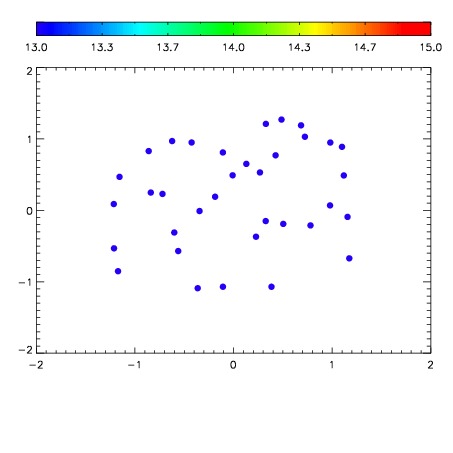

| Frame | Nreads | Zeropoints | Mag plots | Spatial mag deviation | Spatial sky 16325A emission deviations (filled: sky, open: star) | Spatial sky continuum emission | Spatial sky telluric CO2 absorption deviations (filled: H < 10) | |||||||||||||||||||||||
| 0 | 0 |
|
|
|
|
|
|
| IPAIR | NAME | SHIFT | NEWSHIFT | S/N | NAME | SHIFT | NEWSHIFT | S/N |
| 0 | 10250100 | 0.496290 | 0.00000 | 19.0514 | 10250101 | 0.00453620 | 0.491754 | 19.0765 |
| 1 | 10250103 | 0.495702 | 0.000588000 | 19.1766 | 10250102 | 0.00471811 | 0.491572 | 19.1798 |
| 2 | 10250099 | 0.494690 | 0.00160000 | 18.9901 | 10250098 | 0.00435380 | 0.491936 | 19.0165 |
| 3 | 10250096 | 0.491916 | 0.00437400 | 18.9647 | 10250097 | 0.00359406 | 0.492696 | 18.9993 |
| 4 | 10250095 | 0.491320 | 0.00496998 | 18.8914 | 10250094 | 0.00000 | 0.496290 | 18.8321 |