| Red | Green | Blue | |
| z | 17.64 | ||
| znorm | Inf | ||
| sky | -Inf | -Inf | -NaN |
| S/N | 23.7 | 40.1 | 41.9 |
| S/N(c) | 0.0 | 0.0 | 0.0 |
| SN(E/C) |
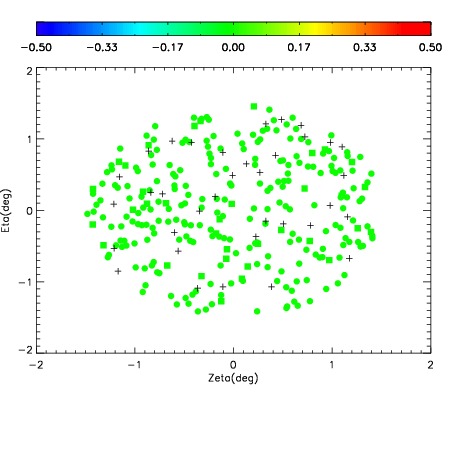
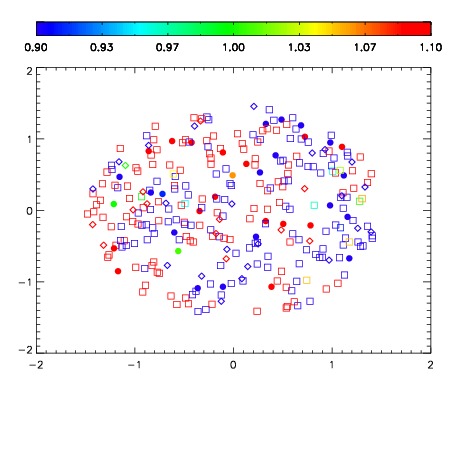
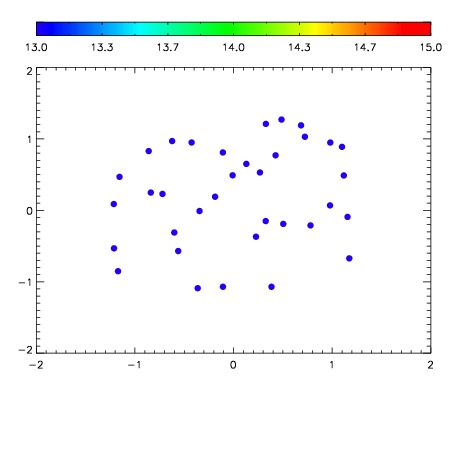

| Frame | Nreads | Zeropoints | Mag plots | Spatial mag deviation | Spatial sky 16325A emission deviations (filled: sky, open: star) | Spatial sky continuum emission | Spatial sky telluric CO2 absorption deviations (filled: H < 10) | |||||||||||||||||||||||
| 0 | 0 |
|
|
|
|
|
|
| IPAIR | NAME | SHIFT | NEWSHIFT | S/N | NAME | SHIFT | NEWSHIFT | S/N |
| 0 | 10310046 | 0.527052 | 0.00000 | 18.8835 | 10310047 | 0.000798589 | 0.526253 | 18.1505 |
| 1 | 10310049 | 0.525690 | 0.00136197 | 19.0568 | 10310051 | 0.000343358 | 0.526709 | 19.0165 |
| 2 | 10310050 | 0.526207 | 0.000845015 | 18.9879 | 10310044 | 0.00000 | 0.527052 | 18.8380 |
| 3 | 10310045 | 0.526043 | 0.00100899 | 18.9407 | 10310048 | 0.000454452 | 0.526598 | 18.5652 |