| Red | Green | Blue | |
| z | 17.64 | ||
| znorm | Inf | ||
| sky | -Inf | -Inf | -Inf |
| S/N | 24.6 | 40.8 | 44.7 |
| S/N(c) | 0.0 | 0.0 | 0.0 |
| SN(E/C) |
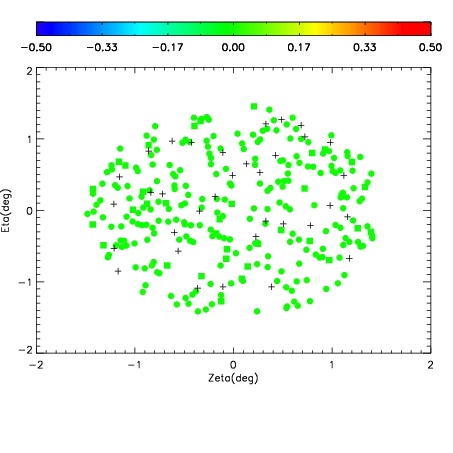
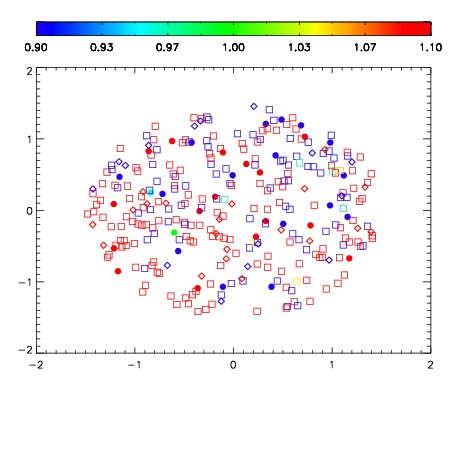
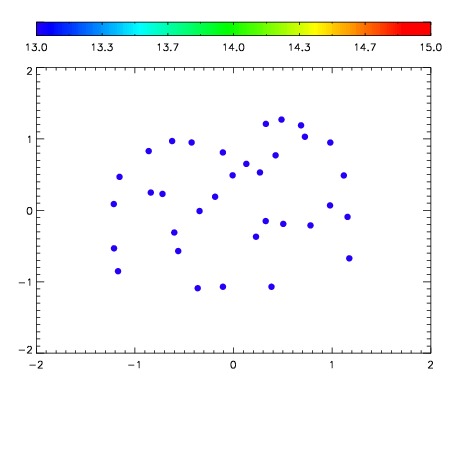

| Frame | Nreads | Zeropoints | Mag plots | Spatial mag deviation | Spatial sky 16325A emission deviations (filled: sky, open: star) | Spatial sky continuum emission | Spatial sky telluric CO2 absorption deviations (filled: H < 10) | |||||||||||||||||||||||
| 0 | 0 |
|
|
|
|
|
|
| IPAIR | NAME | SHIFT | NEWSHIFT | S/N | NAME | SHIFT | NEWSHIFT | S/N |
| 0 | 10750077 | 0.490994 | 0.00000 | 18.8960 | 10750079 | -0.000983562 | 0.491978 | 19.0392 |
| 1 | 10750073 | 0.490718 | 0.000275999 | 18.8678 | 10750076 | -0.000321966 | 0.491316 | 18.9451 |
| 2 | 10750074 | 0.490670 | 0.000324011 | 18.8610 | 10750075 | -0.000699473 | 0.491693 | 18.8708 |
| 3 | 10750078 | 0.489620 | 0.00137401 | 18.8568 | 10750072 | 0.00000 | 0.490994 | 18.7422 |