| Red | Green | Blue | |
| z | 17.64 | ||
| znorm | Inf | ||
| sky | -Inf | -Inf | -Inf |
| S/N | 28.0 | 46.8 | 51.2 |
| S/N(c) | 0.0 | 0.0 | 0.0 |
| SN(E/C) |
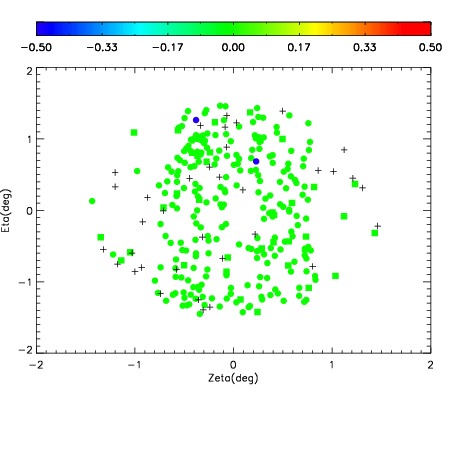
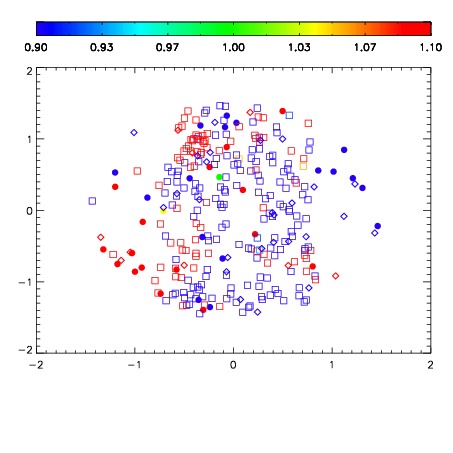


| Frame | Nreads | Zeropoints | Mag plots | Spatial mag deviation | Spatial sky 16325A emission deviations (filled: sky, open: star) | Spatial sky continuum emission | Spatial sky telluric CO2 absorption deviations (filled: H < 10) | |||||||||||||||||||||||
| 0 | 0 |
|
|
|
|
|
|
| IPAIR | NAME | SHIFT | NEWSHIFT | S/N | NAME | SHIFT | NEWSHIFT | S/N |
| 0 | 06980043 | 0.482159 | 0.00000 | 19.1948 | 06980044 | 0.000106924 | 0.482052 | 19.1120 |
| 1 | 06980042 | 0.480996 | 0.00116298 | 19.1352 | 06980041 | -0.00237321 | 0.484532 | 19.0942 |
| 2 | 06980039 | 0.481187 | 0.000972003 | 19.0983 | 06980040 | 5.82700e-05 | 0.482101 | 19.0887 |
| 3 | 06980038 | 0.481001 | 0.00115800 | 19.0203 | 06980037 | 0.00000 | 0.482159 | 18.9930 |