| Red | Green | Blue | |
| z | 17.64 | ||
| znorm | Inf | ||
| sky | -Inf | -Inf | -Inf |
| S/N | 27.8 | 46.2 | 49.6 |
| S/N(c) | 0.0 | 0.0 | 0.0 |
| SN(E/C) |
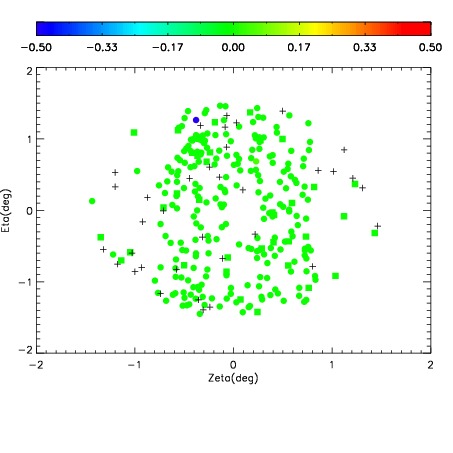
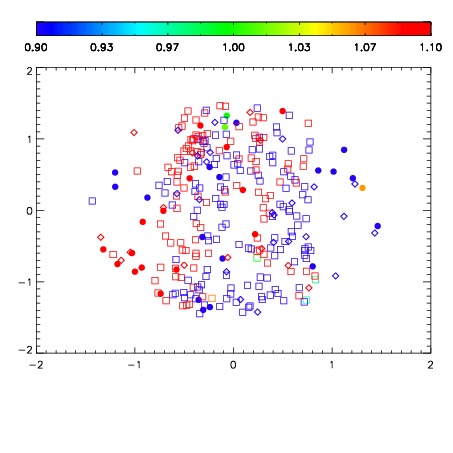


| Frame | Nreads | Zeropoints | Mag plots | Spatial mag deviation | Spatial sky 16325A emission deviations (filled: sky, open: star) | Spatial sky continuum emission | Spatial sky telluric CO2 absorption deviations (filled: H < 10) | |||||||||||||||||||||||
| 0 | 0 |
|
|
|
|
|
|
| IPAIR | NAME | SHIFT | NEWSHIFT | S/N | NAME | SHIFT | NEWSHIFT | S/N |
| 0 | 07020013 | 0.479964 | 0.00000 | 19.0556 | 07020014 | 0.000457455 | 0.479507 | 19.0612 |
| 1 | 07020012 | 0.477637 | 0.00232700 | 19.0871 | 07020011 | 0.00000 | 0.479964 | 19.0881 |
| 2 | 07020017 | 0.478775 | 0.00118899 | 19.0391 | 07020015 | -0.00189486 | 0.481859 | 19.0604 |
| 3 | 07020016 | 0.479391 | 0.000572979 | 19.0190 | 07020018 | 0.000669302 | 0.479295 | 19.0599 |