| Red | Green | Blue | |
| z | 17.64 | ||
| znorm | Inf | ||
| sky | -NaN | -Inf | -Inf |
| S/N | 28.2 | 46.4 | 49.4 |
| S/N(c) | 0.0 | 0.0 | 0.0 |
| SN(E/C) |
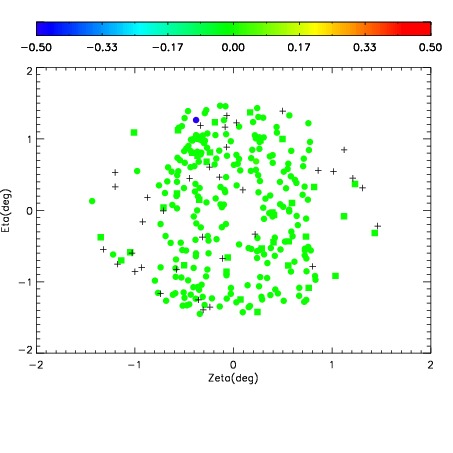
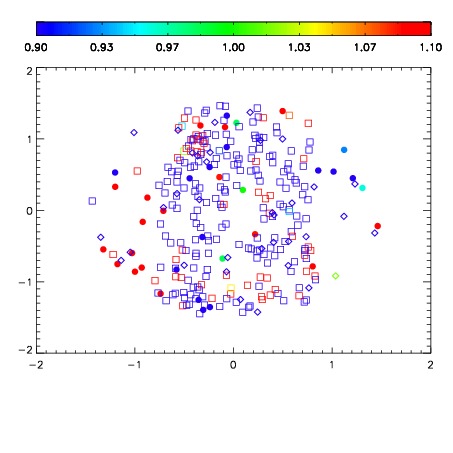


| Frame | Nreads | Zeropoints | Mag plots | Spatial mag deviation | Spatial sky 16325A emission deviations (filled: sky, open: star) | Spatial sky continuum emission | Spatial sky telluric CO2 absorption deviations (filled: H < 10) | |||||||||||||||||||||||
| 0 | 0 |
|
|
|
|
|
|
| IPAIR | NAME | SHIFT | NEWSHIFT | S/N | NAME | SHIFT | NEWSHIFT | S/N |
| 0 | 10240061 | 0.493906 | 0.00000 | 19.0291 | 10240063 | -0.000359642 | 0.494266 | 19.0212 |
| 1 | 10240065 | 0.492186 | 0.00171998 | 19.0916 | 10240066 | -0.00184935 | 0.495755 | 19.1445 |
| 2 | 10240064 | 0.492505 | 0.00140098 | 19.0743 | 10240062 | 7.10341e-05 | 0.493835 | 19.0295 |
| 3 | 10240060 | 0.493732 | 0.000173986 | 18.9952 | 10240059 | 0.00000 | 0.493906 | 18.9560 |