| Red | Green | Blue | |
| z | 17.64 | ||
| znorm | Inf | ||
| sky | -NaN | -Inf | -NaN |
| S/N | 29.4 | 50.4 | 52.7 |
| S/N(c) | 0.0 | 0.0 | 0.0 |
| SN(E/C) |
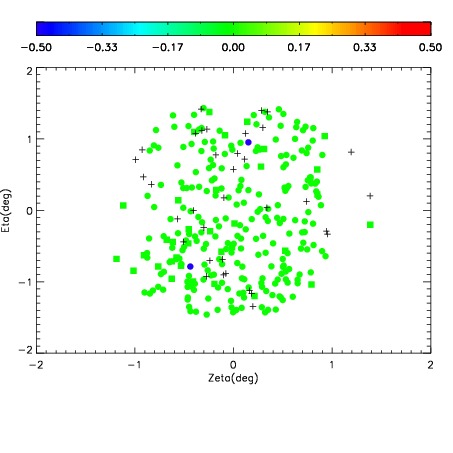

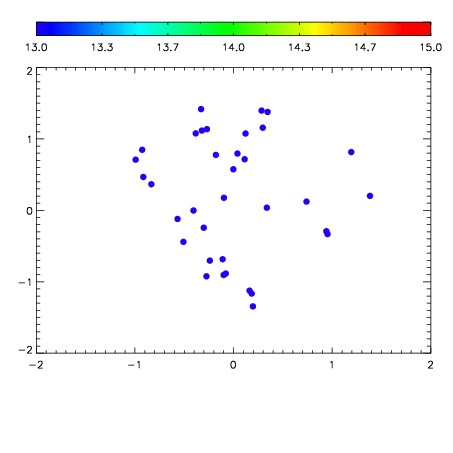

| Frame | Nreads | Zeropoints | Mag plots | Spatial mag deviation | Spatial sky 16325A emission deviations (filled: sky, open: star) | Spatial sky continuum emission | Spatial sky telluric CO2 absorption deviations (filled: H < 10) | |||||||||||||||||||||||
| 0 | 0 |
|
|
|
|
|
|
| IPAIR | NAME | SHIFT | NEWSHIFT | S/N | NAME | SHIFT | NEWSHIFT | S/N |
| 0 | 10260059 | 0.489675 | 0.00000 | 19.1455 | 10260058 | 0.00000 | 0.489675 | 19.1568 |
| 1 | 10260063 | 0.487194 | 0.00248098 | 19.1289 | 10260062 | -0.000687432 | 0.490362 | 19.1085 |
| 2 | 10260064 | 0.487624 | 0.00205100 | 19.1084 | 10260065 | 0.000586306 | 0.489089 | 19.0878 |
| 3 | 10260060 | 0.489226 | 0.000448972 | 19.0047 | 10260061 | -0.000223811 | 0.489899 | 19.0402 |