| Red | Green | Blue | |
| z | 17.64 | ||
| znorm | Inf | ||
| sky | -NaN | -Inf | -Inf |
| S/N | 29.4 | 52.2 | 55.1 |
| S/N(c) | 0.0 | 0.0 | 0.0 |
| SN(E/C) |
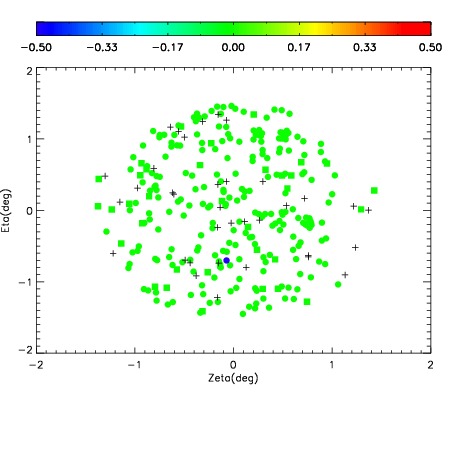


| Frame | Nreads | Zeropoints | Mag plots | Spatial mag deviation | Spatial sky 16325A emission deviations (filled: sky, open: star) | Spatial sky continuum emission | Spatial sky telluric CO2 absorption deviations (filled: H < 10) | |||||||||||||||||||||||
| 0 | 0 |
|
|
|
|
|
|
| IPAIR | NAME | SHIFT | NEWSHIFT | S/N | NAME | SHIFT | NEWSHIFT | S/N |
| 0 | 06950042 | 0.498896 | 0.00000 | 19.0028 | 06950036 | 0.00000 | 0.498896 | 18.9526 |
| 1 | 06950037 | 0.493695 | 0.00520101 | 19.0553 | 06950039 | -0.00106714 | 0.499963 | 19.0005 |
| 2 | 06950038 | 0.494063 | 0.00483301 | 18.9910 | 06950044 | 0.00164610 | 0.497250 | 18.9476 |
| 3 | 06950041 | 0.498091 | 0.000804991 | 18.9497 | 06950040 | 0.00146124 | 0.497435 | 18.8974 |
| 4 | 06950045 | 0.496976 | 0.00192001 | 18.9291 | 06950043 | 0.00128201 | 0.497614 | 18.8863 |