| Red | Green | Blue | |
| z | 17.64 | ||
| znorm | Inf | ||
| sky | -Inf | -Inf | -Inf |
| S/N | 35.9 | 61.5 | 65.0 |
| S/N(c) | 0.0 | 0.0 | 0.0 |
| SN(E/C) |
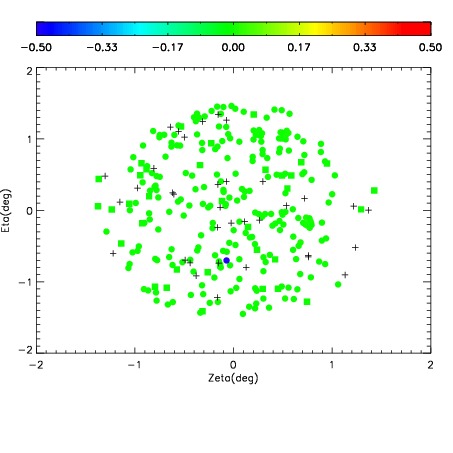
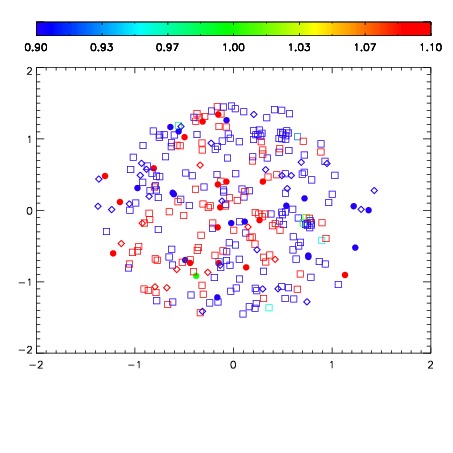


| Frame | Nreads | Zeropoints | Mag plots | Spatial mag deviation | Spatial sky 16325A emission deviations (filled: sky, open: star) | Spatial sky continuum emission | Spatial sky telluric CO2 absorption deviations (filled: H < 10) | |||||||||||||||||||||||
| 0 | 0 |
|
|
|
|
|
|
| IPAIR | NAME | SHIFT | NEWSHIFT | S/N | NAME | SHIFT | NEWSHIFT | S/N |
| 0 | 06990042 | 0.487830 | 0.00000 | 19.1883 | 06990040 | 0.000367445 | 0.487463 | 19.1926 |
| 1 | 06990046 | 0.485462 | 0.00236800 | 19.2386 | 06990044 | 0.00140660 | 0.486423 | 19.2301 |
| 2 | 06990045 | 0.479483 | 0.00834700 | 19.2378 | 06990043 | 0.000551977 | 0.487278 | 19.2248 |
| 3 | 06990041 | 0.479686 | 0.00814402 | 19.2277 | 06990047 | 0.000813882 | 0.487016 | 19.2239 |
| 4 | 06990038 | 0.484903 | 0.00292701 | 19.2058 | 06990039 | 0.000651597 | 0.487178 | 19.2037 |
| 5 | 06990037 | 0.478255 | 0.00957501 | 19.1990 | 06990036 | 0.00000 | 0.487830 | 19.1973 |