| Red | Green | Blue | |
| z | 17.64 | ||
| znorm | Inf | ||
| sky | -Inf | -Inf | -Inf |
| S/N | 16.9 | 29.1 | 30.9 |
| S/N(c) | 0.0 | 0.0 | 0.0 |
| SN(E/C) |
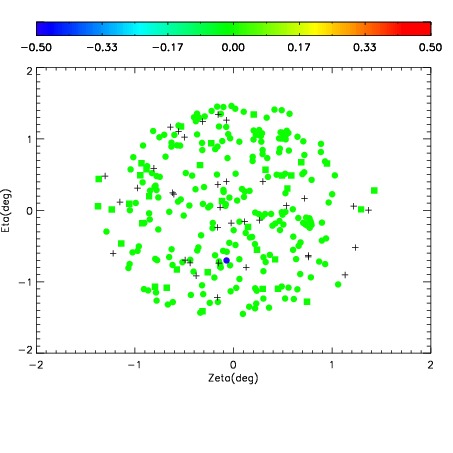
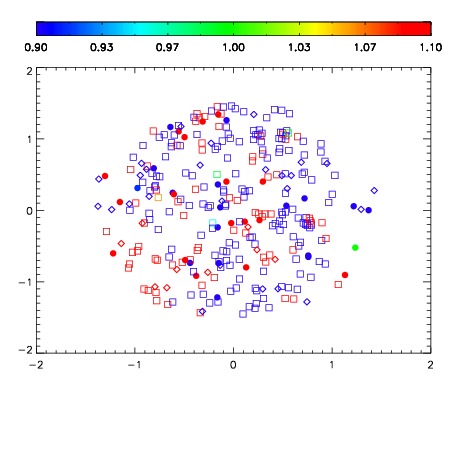


| Frame | Nreads | Zeropoints | Mag plots | Spatial mag deviation | Spatial sky 16325A emission deviations (filled: sky, open: star) | Spatial sky continuum emission | Spatial sky telluric CO2 absorption deviations (filled: H < 10) | |||||||||||||||||||||||
| 0 | 0 |
|
|
|
|
|
|
| IPAIR | NAME | SHIFT | NEWSHIFT | S/N | NAME | SHIFT | NEWSHIFT | S/N |
| 0 | 07260025 | 0.481837 | 0.00000 | 18.7387 | 07260023 | 0.00000 | 0.481837 | 18.4059 |
| 1 | 07260029 | 0.480353 | 0.00148401 | 18.8244 | 07260030 | 0.000548679 | 0.481288 | 18.8925 |
| 2 | 07260024 | 0.480672 | 0.00116500 | 18.4788 | 07260026 | 0.00189521 | 0.479942 | 17.9208 |
| 3 | 07260028 | 0.479360 | 0.00247699 | 17.4362 | 07260027 | 0.000332760 | 0.481504 | 17.5687 |