| Red | Green | Blue | |
| z | 17.64 | ||
| znorm | Inf | ||
| sky | -Inf | -Inf | -Inf |
| S/N | 9.2 | 17.3 | 18.5 |
| S/N(c) | 0.0 | 0.0 | 0.0 |
| SN(E/C) |
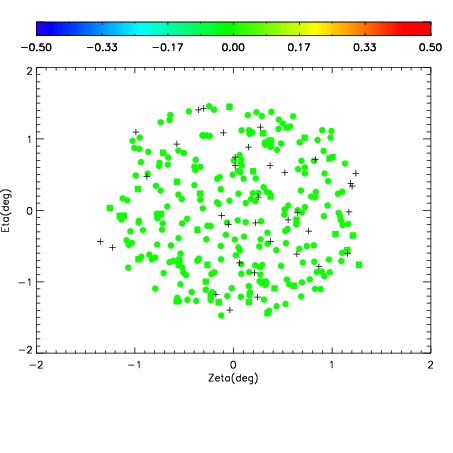
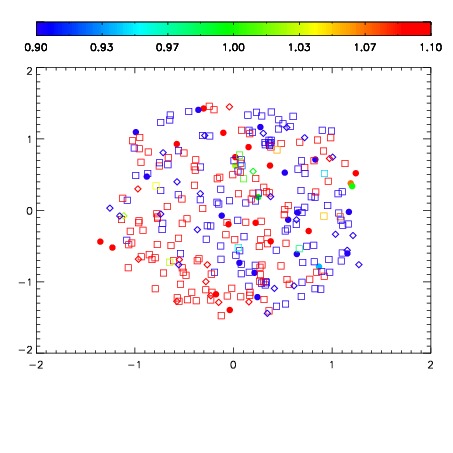
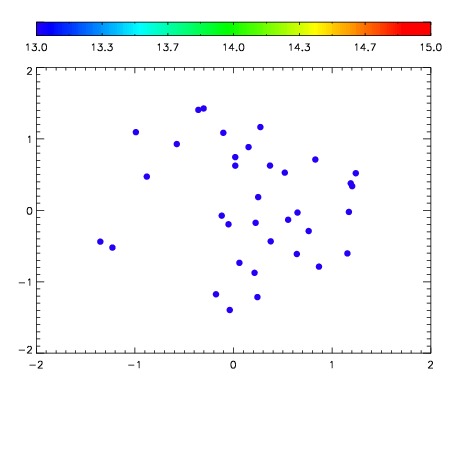

| Frame | Nreads | Zeropoints | Mag plots | Spatial mag deviation | Spatial sky 16325A emission deviations (filled: sky, open: star) | Spatial sky continuum emission | Spatial sky telluric CO2 absorption deviations (filled: H < 10) | |||||||||||||||||||||||
| 0 | 0 |
|
|
|
|
|
|
| IPAIR | NAME | SHIFT | NEWSHIFT | S/N | NAME | SHIFT | NEWSHIFT | S/N |
| 0 | 07290032 | 0.485300 | 0.00000 | 17.1647 | 07290029 | 0.00543589 | 0.479864 | 17.4934 |
| 1 | 07290027 | 0.482121 | 0.00317901 | 17.9168 | 07290026 | 0.00000 | 0.485300 | 18.3439 |
| 2 | 07290028 | 0.482748 | 0.00255200 | 17.7130 | 07290033 | 0.00795876 | 0.477341 | 17.5807 |
| 3 | 07290031 | 0.484928 | 0.000371993 | 17.0796 | 07290030 | 0.00440027 | 0.480900 | 17.3154 |