| Red | Green | Blue | |
| z | 17.64 | ||
| znorm | Inf | ||
| sky | -Inf | -Inf | -Inf |
| S/N | 23.1 | 40.5 | 45.8 |
| S/N(c) | 0.0 | 0.0 | 0.0 |
| SN(E/C) |
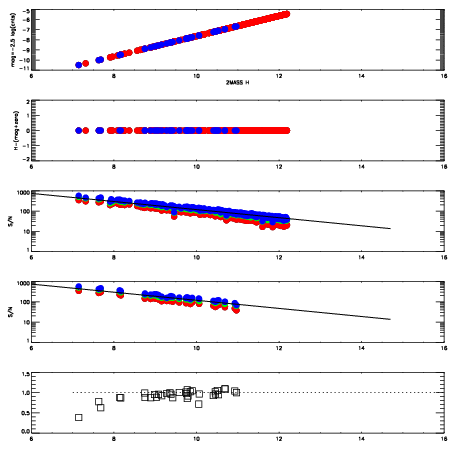
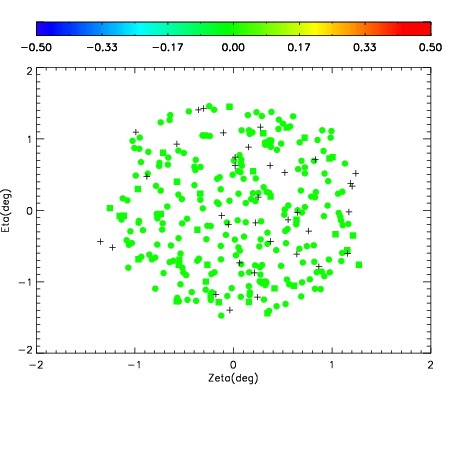
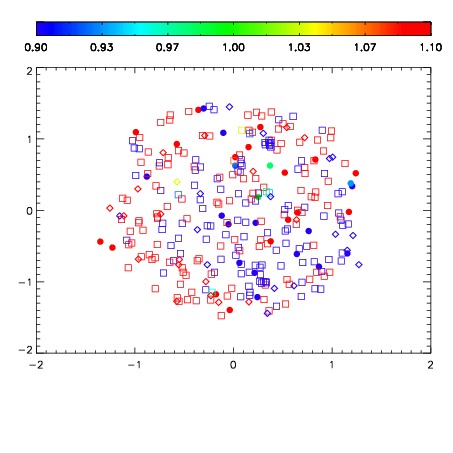


| Frame | Nreads | Zeropoints | Mag plots | Spatial mag deviation | Spatial sky 16325A emission deviations (filled: sky, open: star) | Spatial sky continuum emission | Spatial sky telluric CO2 absorption deviations (filled: H < 10) | |||||||||||||||||||||||
| 0 | 0 |
|
|
|
|
|
|
| IPAIR | NAME | SHIFT | NEWSHIFT | S/N | NAME | SHIFT | NEWSHIFT | S/N |
| 0 | 07500033 | 0.487687 | 0.00000 | 18.7605 | 07500027 | 0.00000 | 0.487687 | 18.7571 |
| 1 | 07500028 | 0.484380 | 0.00330698 | 18.7897 | 07500034 | 0.00334074 | 0.484346 | 18.8356 |
| 2 | 07500029 | 0.484178 | 0.00350899 | 18.7873 | 07500031 | 0.000192150 | 0.487495 | 18.7891 |
| 3 | 07500032 | 0.486979 | 0.000707984 | 18.7158 | 07500030 | -0.000421353 | 0.488108 | 18.7208 |