| Red | Green | Blue | |
| z | 17.64 | ||
| znorm | Inf | ||
| sky | -Inf | -Inf | -Inf |
| S/N | 17.6 | 32.5 | 33.6 |
| S/N(c) | 0.0 | 0.0 | 0.0 |
| SN(E/C) |
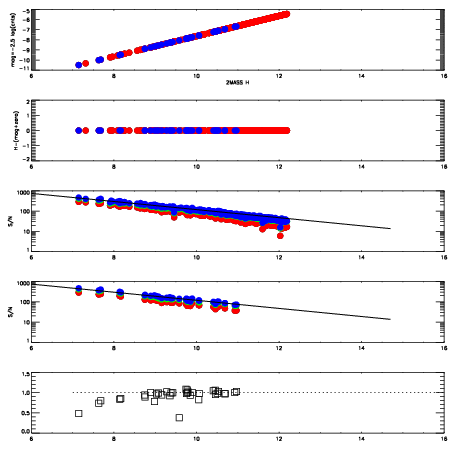
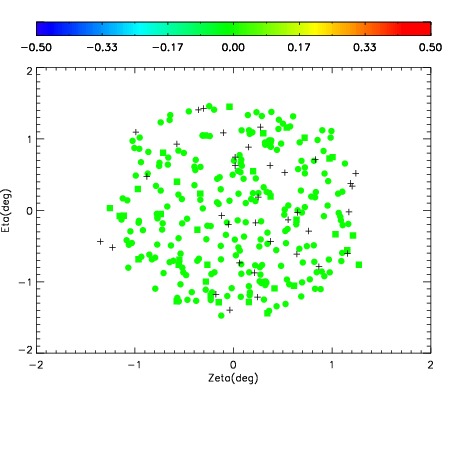
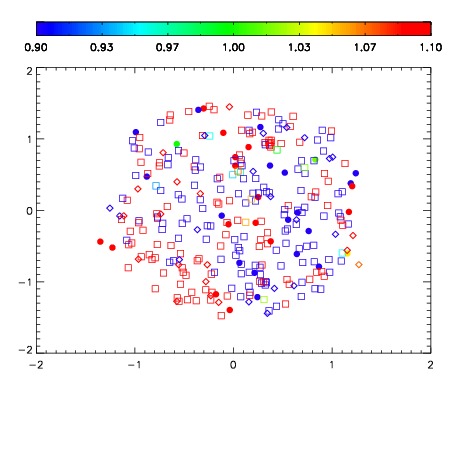


| Frame | Nreads | Zeropoints | Mag plots | Spatial mag deviation | Spatial sky 16325A emission deviations (filled: sky, open: star) | Spatial sky continuum emission | Spatial sky telluric CO2 absorption deviations (filled: H < 10) | |||||||||||||||||||||||
| 0 | 0 |
|
|
|
|
|
|
| IPAIR | NAME | SHIFT | NEWSHIFT | S/N | NAME | SHIFT | NEWSHIFT | S/N |
| 0 | 09970079 | 0.524198 | 0.00000 | 17.6870 | 09970080 | 0.00194447 | 0.522254 | 18.0571 |
| 1 | 09970083 | 0.519857 | 0.00434101 | 18.6557 | 09970077 | 0.00000 | 0.524198 | 18.7988 |
| 2 | 09970082 | 0.520198 | 0.00400001 | 18.5295 | 09970084 | 0.00127741 | 0.522921 | 18.7659 |
| 3 | 09970078 | 0.524129 | 6.90222e-05 | 18.3937 | 09970081 | 0.00104251 | 0.523156 | 18.3479 |