| Red | Green | Blue | |
| z | 17.64 | ||
| znorm | Inf | ||
| sky | -NaN | -NaN | -Inf |
| S/N | 24.2 | 41.6 | 44.4 |
| S/N(c) | 0.0 | 0.0 | 0.0 |
| SN(E/C) |
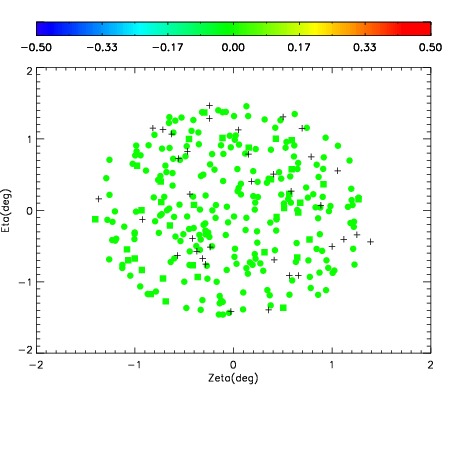
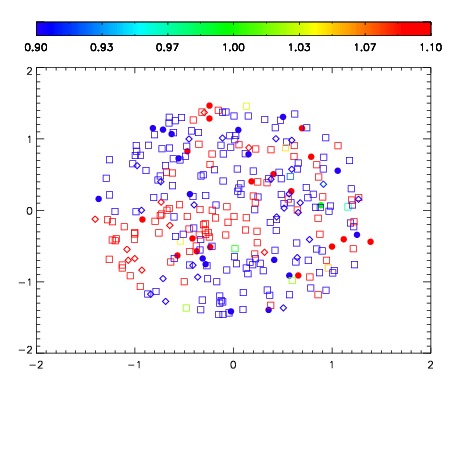


| Frame | Nreads | Zeropoints | Mag plots | Spatial mag deviation | Spatial sky 16325A emission deviations (filled: sky, open: star) | Spatial sky continuum emission | Spatial sky telluric CO2 absorption deviations (filled: H < 10) | |||||||||||||||||||||||
| 0 | 0 |
|
|
|
|
|
|
| IPAIR | NAME | SHIFT | NEWSHIFT | S/N | NAME | SHIFT | NEWSHIFT | S/N |
| 0 | 07030016 | 0.475503 | 0.00000 | 18.9893 | 07030017 | 0.00141904 | 0.474084 | 18.9889 |
| 1 | 07030015 | 0.474873 | 0.000629991 | 18.9595 | 07030013 | 0.00209326 | 0.473410 | 18.9563 |
| 2 | 07030012 | 0.473710 | 0.00179300 | 18.9163 | 07030014 | 0.00163390 | 0.473869 | 18.8701 |
| 3 | 07030011 | 0.473669 | 0.00183401 | 18.8155 | 07030010 | 0.00000 | 0.475503 | 18.7190 |