| Red | Green | Blue | |
| z | 17.64 | ||
| znorm | Inf | ||
| sky | -NaN | -Inf | -Inf |
| S/N | 24.5 | 42.2 | 45.2 |
| S/N(c) | 0.0 | 0.0 | 0.0 |
| SN(E/C) |
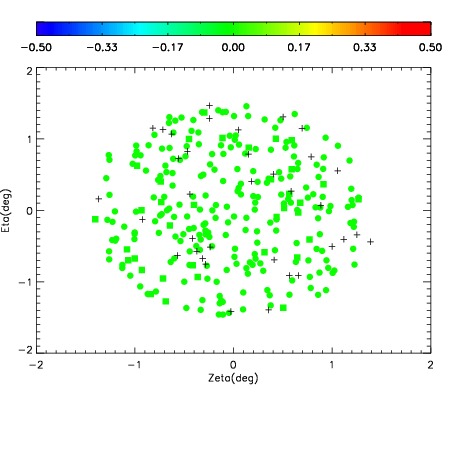


| Frame | Nreads | Zeropoints | Mag plots | Spatial mag deviation | Spatial sky 16325A emission deviations (filled: sky, open: star) | Spatial sky continuum emission | Spatial sky telluric CO2 absorption deviations (filled: H < 10) | |||||||||||||||||||||||
| 0 | 0 |
|
|
|
|
|
|
| IPAIR | NAME | SHIFT | NEWSHIFT | S/N | NAME | SHIFT | NEWSHIFT | S/N |
| 0 | 07280028 | 0.486858 | 0.00000 | 19.0142 | 07280029 | 0.00304421 | 0.483814 | 18.9947 |
| 1 | 07280027 | 0.486448 | 0.000410020 | 19.0113 | 07280026 | 0.00000 | 0.486858 | 18.9774 |
| 2 | 07280031 | 0.485025 | 0.00183302 | 18.9702 | 07280033 | 0.00382280 | 0.483035 | 18.9723 |
| 3 | 07280032 | 0.485878 | 0.000980020 | 18.9369 | 07280030 | 0.00317520 | 0.483683 | 18.8946 |