| Red | Green | Blue | |
| z | 17.64 | ||
| znorm | Inf | ||
| sky | -Inf | -NaN | -Inf |
| S/N | 27.3 | 47.7 | 49.8 |
| S/N(c) | 0.0 | 0.0 | 0.0 |
| SN(E/C) |


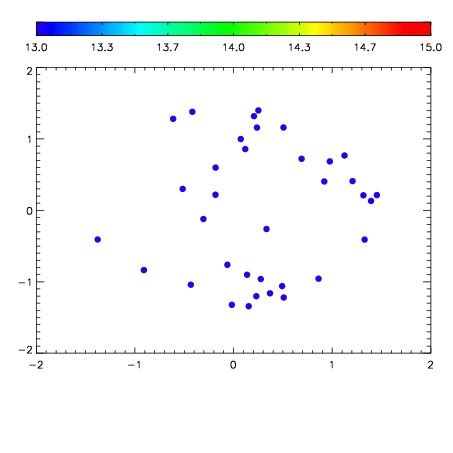

| Frame | Nreads | Zeropoints | Mag plots | Spatial mag deviation | Spatial sky 16325A emission deviations (filled: sky, open: star) | Spatial sky continuum emission | Spatial sky telluric CO2 absorption deviations (filled: H < 10) | |||||||||||||||||||||||
| 0 | 0 |
|
|
|
|
|
|
| IPAIR | NAME | SHIFT | NEWSHIFT | S/N | NAME | SHIFT | NEWSHIFT | S/N |
| 0 | 06950055 | 0.492132 | 0.00000 | 19.1086 | 06950053 | -0.00133372 | 0.493466 | 19.0525 |
| 1 | 06950051 | 0.492031 | 0.000101000 | 19.1484 | 06950052 | 0.000795055 | 0.491337 | 19.1160 |
| 2 | 06950050 | 0.491862 | 0.000270009 | 19.0739 | 06950056 | 3.33261e-05 | 0.492099 | 19.0305 |
| 3 | 06950054 | 0.491731 | 0.000401020 | 19.0230 | 06950049 | 0.00000 | 0.492132 | 19.0087 |