| Red | Green | Blue | |
| z | 17.64 | ||
| znorm | Inf | ||
| sky | -Inf | -Inf | -Inf |
| S/N | 25.0 | 42.4 | 46.1 |
| S/N(c) | 0.0 | 0.0 | 0.0 |
| SN(E/C) |
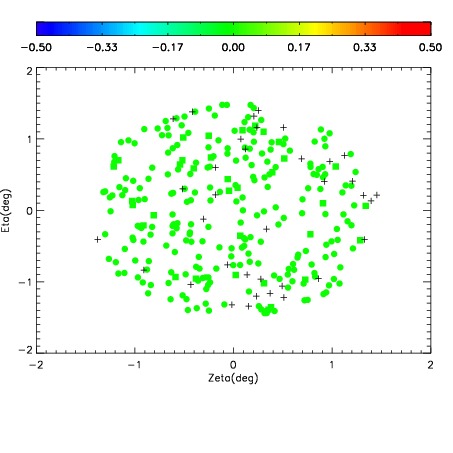


| Frame | Nreads | Zeropoints | Mag plots | Spatial mag deviation | Spatial sky 16325A emission deviations (filled: sky, open: star) | Spatial sky continuum emission | Spatial sky telluric CO2 absorption deviations (filled: H < 10) | |||||||||||||||||||||||
| 0 | 0 |
|
|
|
|
|
|
| IPAIR | NAME | SHIFT | NEWSHIFT | S/N | NAME | SHIFT | NEWSHIFT | S/N |
| 0 | 07510012 | 0.471645 | 0.00000 | 19.0026 | 07510014 | 0.000632816 | 0.471012 | 19.0269 |
| 1 | 07510011 | 0.471257 | 0.000387996 | 18.9778 | 07510010 | 0.00000 | 0.471645 | 18.9871 |
| 2 | 07510015 | 0.470667 | 0.000977993 | 18.9491 | 07510017 | 0.00371809 | 0.467927 | 18.9429 |
| 3 | 07510016 | 0.470825 | 0.000820011 | 18.8638 | 07510013 | 0.00101225 | 0.470633 | 18.9318 |