| Red | Green | Blue | |
| z | 17.64 | ||
| znorm | Inf | ||
| sky | -Inf | -NaN | -Inf |
| S/N | 25.6 | 45.0 | 48.1 |
| S/N(c) | 0.0 | 0.0 | 0.0 |
| SN(E/C) |
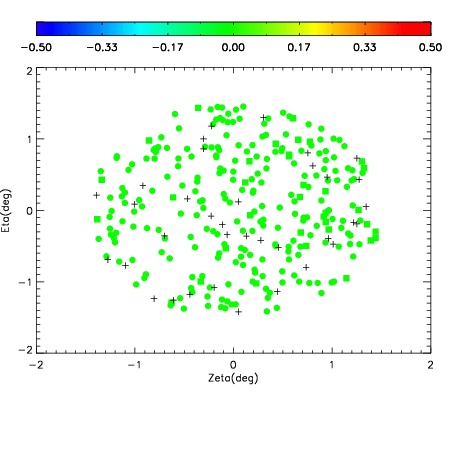
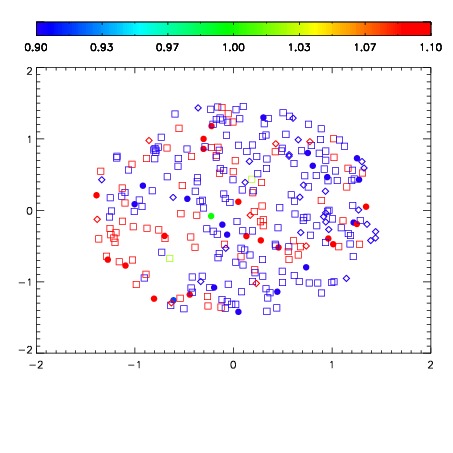


| Frame | Nreads | Zeropoints | Mag plots | Spatial mag deviation | Spatial sky 16325A emission deviations (filled: sky, open: star) | Spatial sky continuum emission | Spatial sky telluric CO2 absorption deviations (filled: H < 10) | |||||||||||||||||||||||
| 0 | 0 |
|
|
|
|
|
|
| IPAIR | NAME | SHIFT | NEWSHIFT | S/N | NAME | SHIFT | NEWSHIFT | S/N |
| 0 | 06940056 | 0.500953 | 0.00000 | 19.0551 | 06940057 | 0.000895588 | 0.500057 | 19.0364 |
| 1 | 06940052 | 0.497318 | 0.00363502 | 19.0397 | 06940053 | -8.75366e-05 | 0.501041 | 19.0058 |
| 2 | 06940055 | 0.500746 | 0.000207007 | 19.0086 | 06940054 | 0.00402753 | 0.496926 | 18.9950 |
| 3 | 06940051 | 0.496849 | 0.00410402 | 18.9787 | 06940050 | 0.00000 | 0.500953 | 18.9689 |