| Red | Green | Blue | |
| z | 17.64 | ||
| znorm | Inf | ||
| sky | -NaN | -NaN | -Inf |
| S/N | 26.4 | 44.8 | 48.8 |
| S/N(c) | 0.0 | 0.0 | 0.0 |
| SN(E/C) |
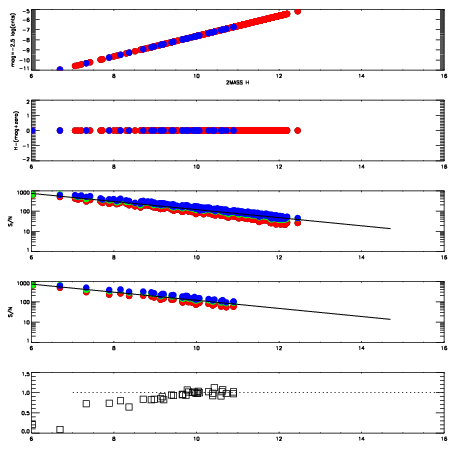

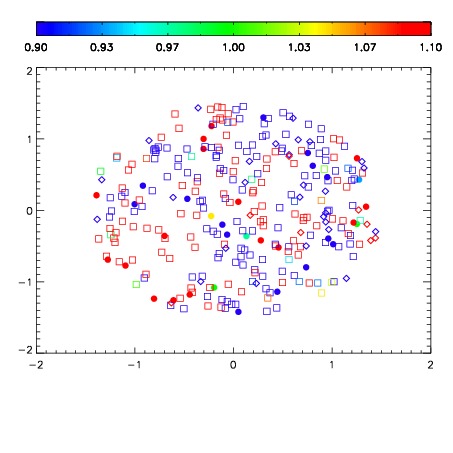


| Frame | Nreads | Zeropoints | Mag plots | Spatial mag deviation | Spatial sky 16325A emission deviations (filled: sky, open: star) | Spatial sky continuum emission | Spatial sky telluric CO2 absorption deviations (filled: H < 10) | |||||||||||||||||||||||
| 0 | 0 |
|
|
|
|
|
|
| IPAIR | NAME | SHIFT | NEWSHIFT | S/N | NAME | SHIFT | NEWSHIFT | S/N |
| 0 | 07000052 | 0.481985 | 0.00000 | 18.9759 | 07000054 | 0.000471039 | 0.481514 | 18.9615 |
| 1 | 07000051 | 0.480355 | 0.00163001 | 19.0930 | 07000050 | 0.00000 | 0.481985 | 19.1635 |
| 2 | 07000056 | 0.481984 | 1.01328e-06 | 19.0267 | 07000053 | 0.000190098 | 0.481795 | 19.1472 |
| 3 | 07000055 | 0.481116 | 0.000869006 | 18.9855 | 07000057 | -0.000585583 | 0.482571 | 19.1191 |