| Red | Green | Blue | |
| z | 17.64 | ||
| znorm | Inf | ||
| sky | -Inf | -Inf | -Inf |
| S/N | 19.9 | 36.8 | 39.0 |
| S/N(c) | 0.0 | 0.0 | 0.0 |
| SN(E/C) |


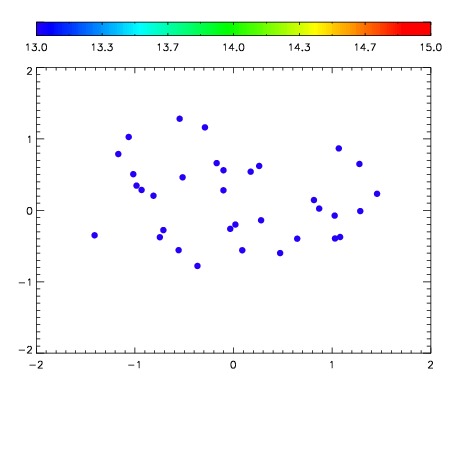

| Frame | Nreads | Zeropoints | Mag plots | Spatial mag deviation | Spatial sky 16325A emission deviations (filled: sky, open: star) | Spatial sky continuum emission | Spatial sky telluric CO2 absorption deviations (filled: H < 10) | |||||||||||||||||||||||
| 0 | 0 |
|
|
|
|
|
|
| IPAIR | NAME | SHIFT | NEWSHIFT | S/N | NAME | SHIFT | NEWSHIFT | S/N |
| 0 | 07220034 | 0.476363 | 0.00000 | 18.1173 | 07220033 | 0.00000 | 0.476363 | 18.1899 |
| 1 | 07220039 | 0.473565 | 0.00279799 | 18.6127 | 07220040 | 0.00639081 | 0.469972 | 18.6149 |
| 2 | 07220038 | 0.473575 | 0.00278801 | 18.5210 | 07220041 | -0.00110453 | 0.477468 | 18.6117 |
| 3 | 07220035 | 0.476278 | 8.49962e-05 | 18.5122 | 07220037 | 0.00317413 | 0.473189 | 18.4137 |
| 4 | 07220042 | 0.473185 | 0.00317800 | 18.3221 | 07220036 | 0.000250166 | 0.476113 | 18.2791 |