| Red | Green | Blue | |
| z | 17.64 | ||
| znorm | Inf | ||
| sky | -NaN | -NaN | -Inf |
| S/N | 26.9 | 46.8 | 49.4 |
| S/N(c) | 0.0 | 0.0 | 0.0 |
| SN(E/C) |
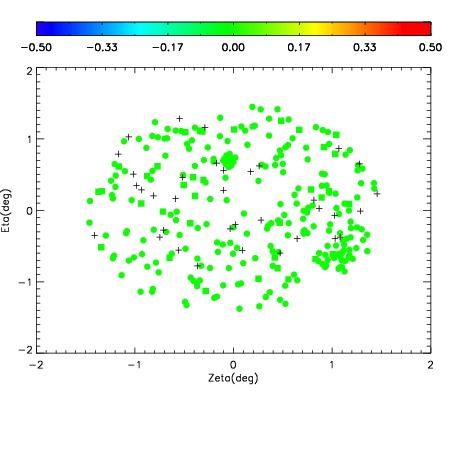
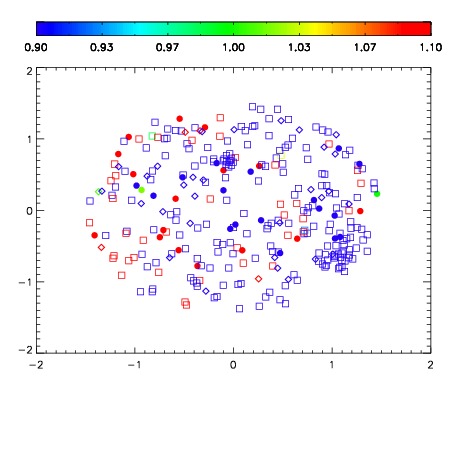
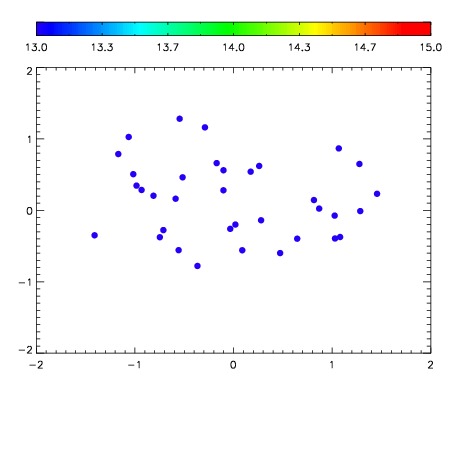

| Frame | Nreads | Zeropoints | Mag plots | Spatial mag deviation | Spatial sky 16325A emission deviations (filled: sky, open: star) | Spatial sky continuum emission | Spatial sky telluric CO2 absorption deviations (filled: H < 10) | |||||||||||||||||||||||
| 0 | 0 |
|
|
|
|
|
|
| IPAIR | NAME | SHIFT | NEWSHIFT | S/N | NAME | SHIFT | NEWSHIFT | S/N |
| 0 | 07280042 | 0.488636 | 0.00000 | 19.0612 | 07280037 | 0.00000 | 0.488636 | 19.0124 |
| 1 | 07280038 | 0.482054 | 0.00658199 | 19.0725 | 07280040 | 0.000364650 | 0.488271 | 19.0785 |
| 2 | 07280039 | 0.482473 | 0.00616300 | 19.0686 | 07280041 | 0.000135611 | 0.488500 | 19.0784 |
| 3 | 07280043 | 0.488571 | 6.49989e-05 | 19.0418 | 07280044 | 0.00149606 | 0.487140 | 18.9602 |