| Red | Green | Blue | |
| z | 17.64 | ||
| znorm | Inf | ||
| sky | -NaN | -NaN | -Inf |
| S/N | 24.8 | 44.2 | 45.9 |
| S/N(c) | 0.0 | 0.0 | 0.0 |
| SN(E/C) |


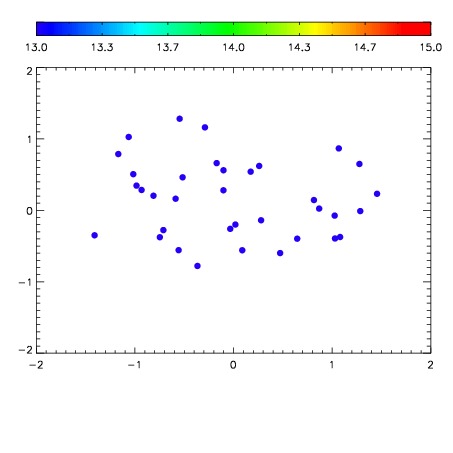

| Frame | Nreads | Zeropoints | Mag plots | Spatial mag deviation | Spatial sky 16325A emission deviations (filled: sky, open: star) | Spatial sky continuum emission | Spatial sky telluric CO2 absorption deviations (filled: H < 10) | |||||||||||||||||||||||
| 0 | 0 |
|
|
|
|
|
|
| IPAIR | NAME | SHIFT | NEWSHIFT | S/N | NAME | SHIFT | NEWSHIFT | S/N |
| 0 | 10230079 | 0.500583 | 0.00000 | 19.0061 | 10230073 | 0.00000 | 0.500583 | 18.9933 |
| 1 | 10230074 | 0.499995 | 0.000588000 | 19.0129 | 10230076 | 0.00195167 | 0.498631 | 19.0214 |
| 2 | 10230075 | 0.500210 | 0.000373006 | 19.0083 | 10230077 | 0.00167664 | 0.498906 | 19.0038 |
| 3 | 10230078 | 0.500480 | 0.000102997 | 18.9465 | 10230080 | 0.00304846 | 0.497535 | 18.9113 |