| Red | Green | Blue | |
| z | 17.64 | ||
| znorm | Inf | ||
| sky | -Inf | -Inf | -Inf |
| S/N | 27.4 | 45.7 | 50.1 |
| S/N(c) | 0.0 | 0.0 | 0.0 |
| SN(E/C) |

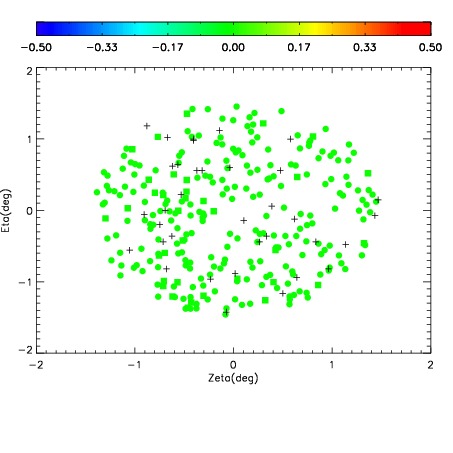


| Frame | Nreads | Zeropoints | Mag plots | Spatial mag deviation | Spatial sky 16325A emission deviations (filled: sky, open: star) | Spatial sky continuum emission | Spatial sky telluric CO2 absorption deviations (filled: H < 10) | |||||||||||||||||||||||
| 0 | 0 |
|
|
|
|
|
|
| IPAIR | NAME | SHIFT | NEWSHIFT | S/N | NAME | SHIFT | NEWSHIFT | S/N |
| 0 | 06950062 | 0.495547 | 0.00000 | 19.0016 | 06950060 | 0.00000 | 0.495547 | 18.9913 |
| 1 | 06950066 | 0.491705 | 0.00384200 | 19.0597 | 06950067 | 0.000292990 | 0.495254 | 19.0992 |
| 2 | 06950065 | 0.491474 | 0.00407299 | 19.0330 | 06950064 | 0.00223294 | 0.493314 | 19.0171 |
| 3 | 06950061 | 0.495270 | 0.000276983 | 18.9526 | 06950063 | 0.00366828 | 0.491879 | 18.9795 |