| Red | Green | Blue | |
| z | 17.64 | ||
| znorm | Inf | ||
| sky | -Inf | -Inf | -Inf |
| S/N | 29.6 | 48.4 | 52.0 |
| S/N(c) | 0.0 | 0.0 | 0.0 |
| SN(E/C) |

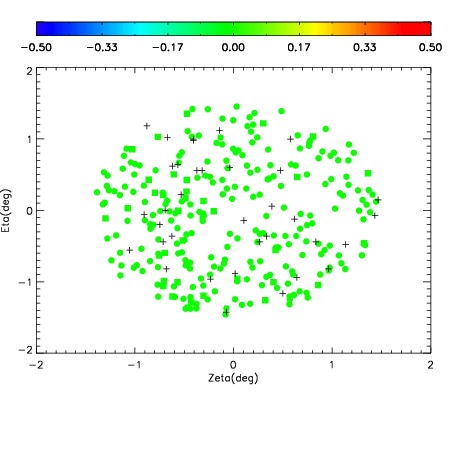


| Frame | Nreads | Zeropoints | Mag plots | Spatial mag deviation | Spatial sky 16325A emission deviations (filled: sky, open: star) | Spatial sky continuum emission | Spatial sky telluric CO2 absorption deviations (filled: H < 10) | |||||||||||||||||||||||
| 0 | 0 |
|
|
|
|
|
|
| IPAIR | NAME | SHIFT | NEWSHIFT | S/N | NAME | SHIFT | NEWSHIFT | S/N |
| 0 | 10220087 | 0.497068 | 0.00000 | 19.0093 | 10220085 | 0.00000 | 0.497068 | 19.0191 |
| 1 | 10220091 | 0.495448 | 0.00161999 | 19.1496 | 10220089 | 0.00237255 | 0.494695 | 19.1224 |
| 2 | 10220090 | 0.495384 | 0.00168398 | 19.1334 | 10220088 | 0.00218372 | 0.494884 | 19.1188 |
| 3 | 10220086 | 0.496256 | 0.000811994 | 19.0301 | 10220092 | 0.00327045 | 0.493798 | 19.1081 |