| Red | Green | Blue | |
| z | 17.64 | ||
| znorm | Inf | ||
| sky | -Inf | -NaN | -NaN |
| S/N | 30.9 | 50.1 | 52.8 |
| S/N(c) | 0.0 | 0.0 | 0.0 |
| SN(E/C) |
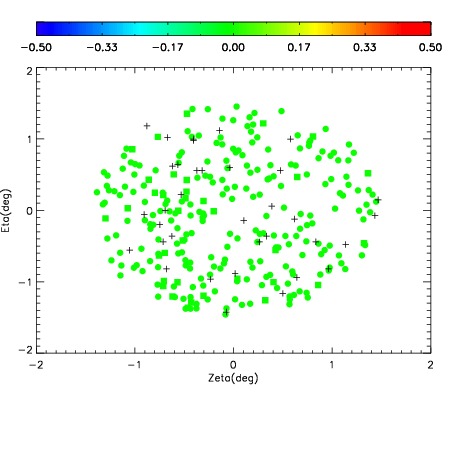
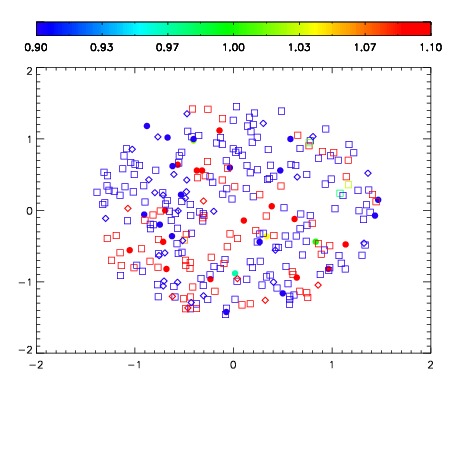
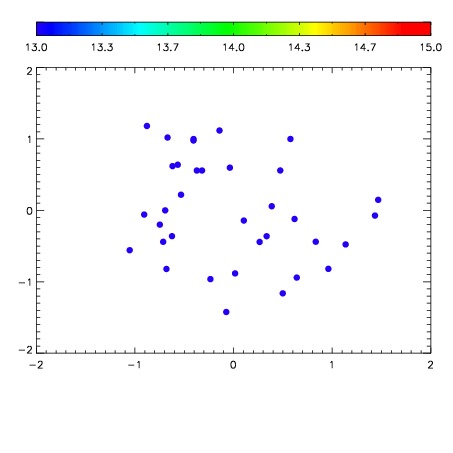

| Frame | Nreads | Zeropoints | Mag plots | Spatial mag deviation | Spatial sky 16325A emission deviations (filled: sky, open: star) | Spatial sky continuum emission | Spatial sky telluric CO2 absorption deviations (filled: H < 10) | |||||||||||||||||||||||
| 0 | 0 |
|
|
|
|
|
|
| IPAIR | NAME | SHIFT | NEWSHIFT | S/N | NAME | SHIFT | NEWSHIFT | S/N |
| 0 | 10290032 | 0.488784 | 0.00000 | 19.1544 | 10290033 | 0.000127227 | 0.488657 | 19.2014 |
| 1 | 10290036 | 0.487292 | 0.00149199 | 19.1467 | 10290034 | 0.000768567 | 0.488015 | 19.1784 |
| 2 | 10290031 | 0.488471 | 0.000312984 | 19.1429 | 10290037 | -0.00132550 | 0.490109 | 19.1658 |
| 3 | 10290035 | 0.487218 | 0.00156599 | 19.1281 | 10290030 | 0.00000 | 0.488784 | 19.0989 |