| Red | Green | Blue | |
| z | 17.64 | ||
| znorm | Inf | ||
| sky | -Inf | -Inf | -Inf |
| S/N | 27.9 | 45.4 | 49.6 |
| S/N(c) | 0.0 | 0.0 | 0.0 |
| SN(E/C) |
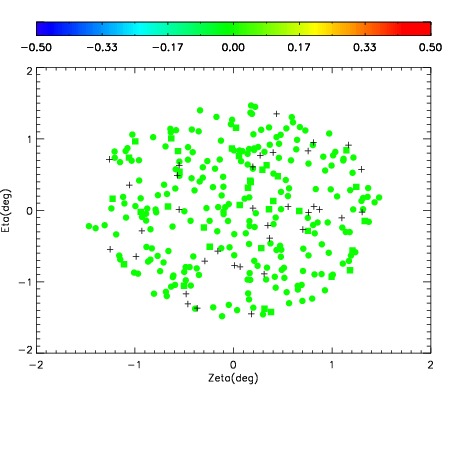
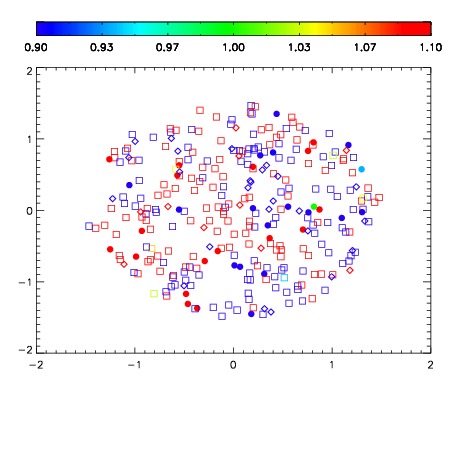
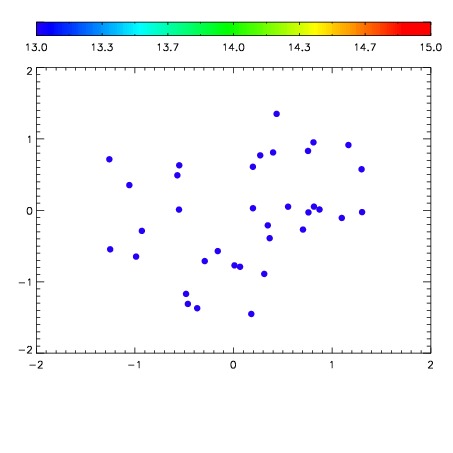

| Frame | Nreads | Zeropoints | Mag plots | Spatial mag deviation | Spatial sky 16325A emission deviations (filled: sky, open: star) | Spatial sky continuum emission | Spatial sky telluric CO2 absorption deviations (filled: H < 10) | |||||||||||||||||||||||
| 0 | 0 |
|
|
|
|
|
|
| IPAIR | NAME | SHIFT | NEWSHIFT | S/N | NAME | SHIFT | NEWSHIFT | S/N |
| 0 | 06940066 | 0.494311 | 0.00000 | 19.0669 | 06940061 | 0.00000 | 0.494311 | 18.9695 |
| 1 | 06940063 | 0.492594 | 0.00171700 | 19.1273 | 06940065 | 0.000214858 | 0.494096 | 19.0604 |
| 2 | 06940067 | 0.494178 | 0.000133008 | 19.0968 | 06940064 | 0.000944654 | 0.493366 | 19.0488 |
| 3 | 06940062 | 0.493182 | 0.00112900 | 19.0871 | 06940068 | -0.00199876 | 0.496310 | 19.0094 |