| Red | Green | Blue | |
| z | 17.64 | ||
| znorm | Inf | ||
| sky | -NaN | -NaN | -Inf |
| S/N | 23.3 | 38.5 | 40.4 |
| S/N(c) | 0.0 | 0.0 | 0.0 |
| SN(E/C) |
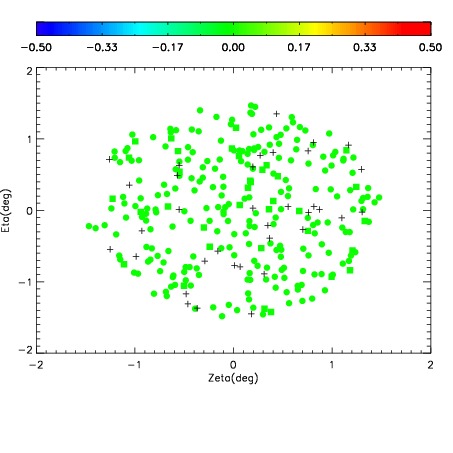


| Frame | Nreads | Zeropoints | Mag plots | Spatial mag deviation | Spatial sky 16325A emission deviations (filled: sky, open: star) | Spatial sky continuum emission | Spatial sky telluric CO2 absorption deviations (filled: H < 10) | |||||||||||||||||||||||
| 0 | 0 |
|
|
|
|
|
|
| IPAIR | NAME | SHIFT | NEWSHIFT | S/N | NAME | SHIFT | NEWSHIFT | S/N |
| 0 | 07040013 | 0.469332 | 0.00000 | 18.7255 | 07040014 | 0.00121876 | 0.468113 | 18.5655 |
| 1 | 07040017 | 0.467319 | 0.00201300 | 18.8397 | 07040018 | 0.000767574 | 0.468564 | 18.9171 |
| 2 | 07040012 | 0.468691 | 0.000641018 | 18.8048 | 07040011 | 0.00000 | 0.469332 | 18.6883 |
| 3 | 07040016 | 0.467659 | 0.00167301 | 18.7513 | 07040015 | -0.000685282 | 0.470017 | 18.6414 |