| Red | Green | Blue | |
| z | 17.64 | ||
| znorm | Inf | ||
| sky | -NaN | -NaN | -Inf |
| S/N | 22.4 | 39.1 | 43.5 |
| S/N(c) | 0.0 | 0.0 | 0.0 |
| SN(E/C) |
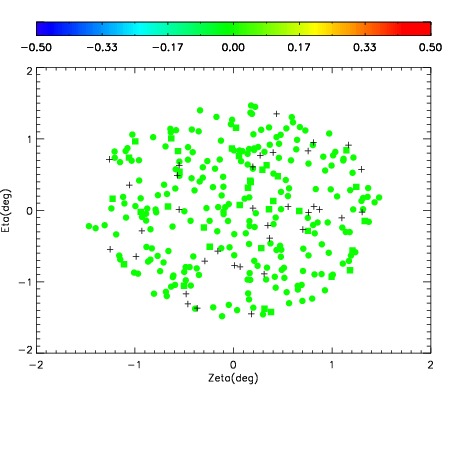


| Frame | Nreads | Zeropoints | Mag plots | Spatial mag deviation | Spatial sky 16325A emission deviations (filled: sky, open: star) | Spatial sky continuum emission | Spatial sky telluric CO2 absorption deviations (filled: H < 10) | |||||||||||||||||||||||
| 0 | 0 |
|
|
|
|
|
|
| IPAIR | NAME | SHIFT | NEWSHIFT | S/N | NAME | SHIFT | NEWSHIFT | S/N |
| 0 | 07500048 | 0.493129 | 0.00000 | 18.7849 | 07500042 | 0.00000 | 0.493129 | 18.7358 |
| 1 | 07500044 | 0.492241 | 0.000887990 | 18.7908 | 07500046 | 0.00585966 | 0.487269 | 18.8066 |
| 2 | 07500047 | 0.492333 | 0.000795990 | 18.7891 | 07500049 | 0.00869630 | 0.484433 | 18.7898 |
| 3 | 07500043 | 0.491041 | 0.00208798 | 18.7393 | 07500045 | 0.00397459 | 0.489154 | 18.7192 |