| Red | Green | Blue | |
| z | 17.64 | ||
| znorm | Inf | ||
| sky | -Inf | -Inf | -Inf |
| S/N | 27.9 | 48.3 | 51.2 |
| S/N(c) | 0.0 | 0.0 | 0.0 |
| SN(E/C) |
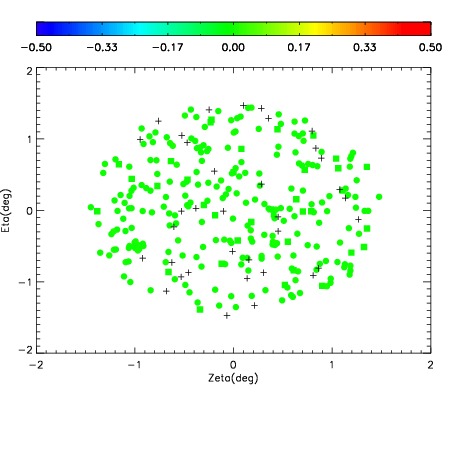

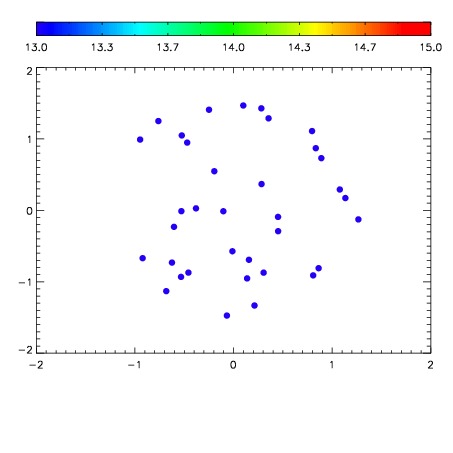

| Frame | Nreads | Zeropoints | Mag plots | Spatial mag deviation | Spatial sky 16325A emission deviations (filled: sky, open: star) | Spatial sky continuum emission | Spatial sky telluric CO2 absorption deviations (filled: H < 10) | |||||||||||||||||||||||
| 0 | 0 |
|
|
|
|
|
|
| IPAIR | NAME | SHIFT | NEWSHIFT | S/N | NAME | SHIFT | NEWSHIFT | S/N |
| 0 | 10790089 | 0.492552 | 0.00000 | 18.8939 | 10790087 | -0.00388540 | 0.496437 | 18.9113 |
| 1 | 10790086 | 0.490749 | 0.00180301 | 18.8702 | 10790088 | -0.00355681 | 0.496109 | 18.8789 |
| 2 | 10790090 | 0.492533 | 1.90139e-05 | 18.8564 | 10790091 | -0.00364375 | 0.496196 | 18.8538 |
| 3 | 10790085 | 0.491622 | 0.000930011 | 18.7630 | 10790084 | -0.00381583 | 0.496368 | 18.7661 |
| 4 | 10790081 | 0.491560 | 0.000992000 | 18.7434 | 10790080 | 0.00000 | 0.492552 | 18.7072 |
| 5 | 10790082 | 0.492083 | 0.000468999 | 18.7090 | 10790083 | -0.00389687 | 0.496449 | 18.6601 |