| Red | Green | Blue | |
| z | 17.64 | ||
| znorm | Inf | ||
| sky | -NaN | -NaN | -Inf |
| S/N | 28.0 | 46.4 | 49.3 |
| S/N(c) | 0.0 | 0.0 | 0.0 |
| SN(E/C) |
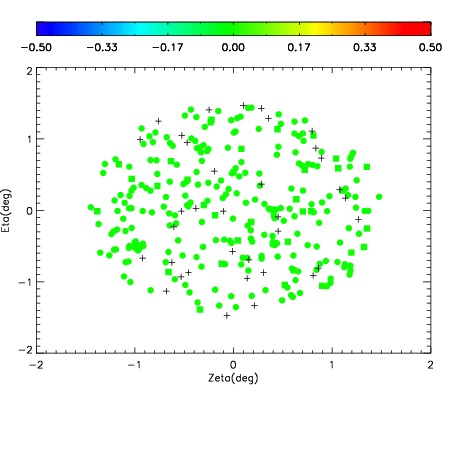
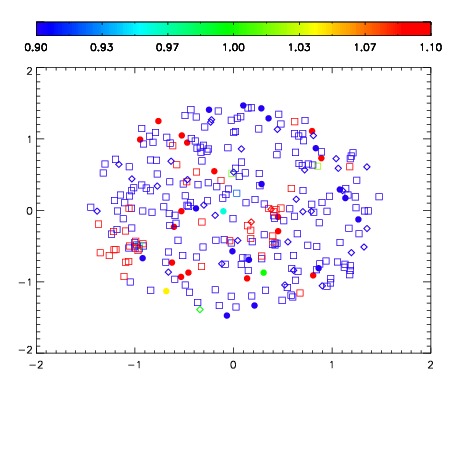


| Frame | Nreads | Zeropoints | Mag plots | Spatial mag deviation | Spatial sky 16325A emission deviations (filled: sky, open: star) | Spatial sky continuum emission | Spatial sky telluric CO2 absorption deviations (filled: H < 10) | |||||||||||||||||||||||
| 0 | 0 |
|
|
|
|
|
|
| IPAIR | NAME | SHIFT | NEWSHIFT | S/N | NAME | SHIFT | NEWSHIFT | S/N |
| 0 | 11110060 | 0.474715 | 0.00000 | 19.0605 | 11110062 | -0.00259702 | 0.477312 | 19.0678 |
| 1 | 11110064 | 0.472184 | 0.00253099 | 19.1289 | 11110063 | -0.00266415 | 0.477379 | 19.1492 |
| 2 | 11110065 | 0.473141 | 0.00157398 | 19.1034 | 11110066 | -0.00280643 | 0.477521 | 19.0908 |
| 3 | 11110061 | 0.474530 | 0.000184983 | 19.0296 | 11110059 | 0.00000 | 0.474715 | 19.0355 |