| Red | Green | Blue | |
| z | 17.64 | ||
| znorm | Inf | ||
| sky | -Inf | -Inf | -Inf |
| S/N | 23.9 | 40.5 | 42.8 |
| S/N(c) | 0.0 | 0.0 | 0.0 |
| SN(E/C) |
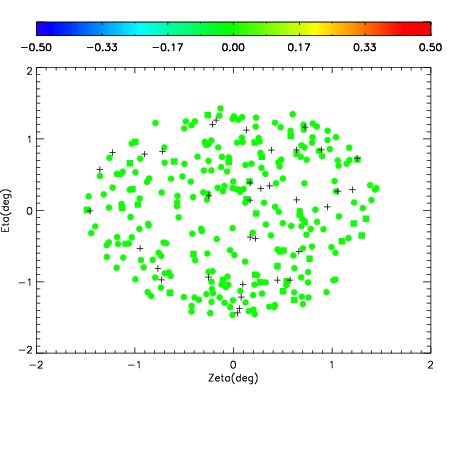
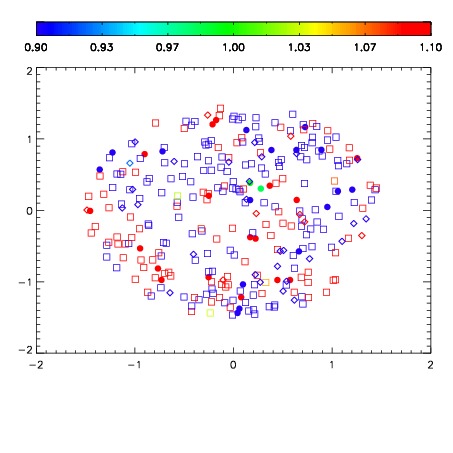
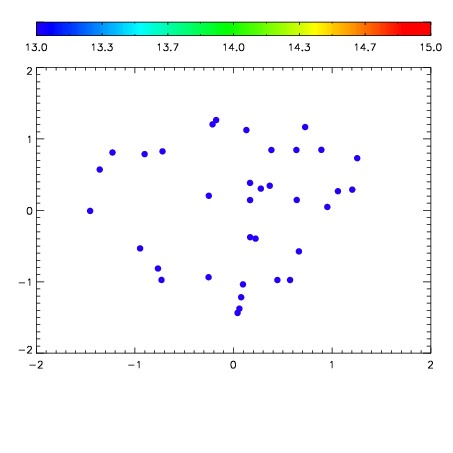

| Frame | Nreads | Zeropoints | Mag plots | Spatial mag deviation | Spatial sky 16325A emission deviations (filled: sky, open: star) | Spatial sky continuum emission | Spatial sky telluric CO2 absorption deviations (filled: H < 10) | |||||||||||||||||||||||
| 0 | 0 |
|
|
|
|
|
|
| IPAIR | NAME | SHIFT | NEWSHIFT | S/N | NAME | SHIFT | NEWSHIFT | S/N |
| 0 | 07850032 | 0.471338 | 0.00000 | 18.6441 | 07850026 | 0.00000 | 0.471338 | 18.8717 |
| 1 | 07850027 | 0.470792 | 0.000546008 | 18.8637 | 07850029 | -0.00270213 | 0.474040 | 18.9651 |
| 2 | 07850028 | 0.470166 | 0.00117201 | 18.8512 | 07850033 | -0.00182555 | 0.473164 | 18.9086 |
| 3 | 07850031 | 0.470202 | 0.00113600 | 18.8341 | 07850030 | -0.00297480 | 0.474313 | 18.8734 |