| Red | Green | Blue | |
| z | 17.63 | ||
| znorm | Inf | ||
| sky | -NaN | -NaN | -Inf |
| S/N | 26.3 | 43.5 | 47.4 |
| S/N(c) | 0.0 | 0.0 | 0.0 |
| SN(E/C) |
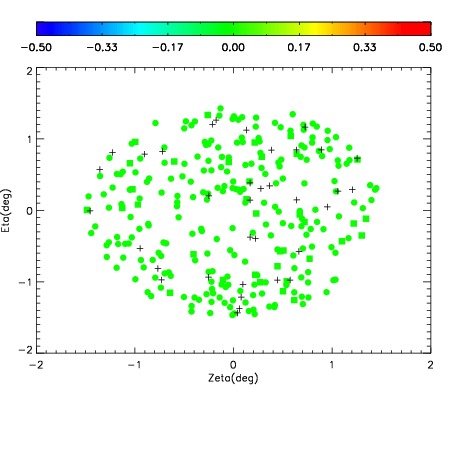
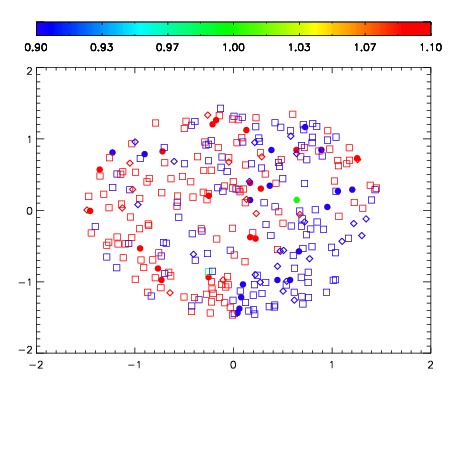
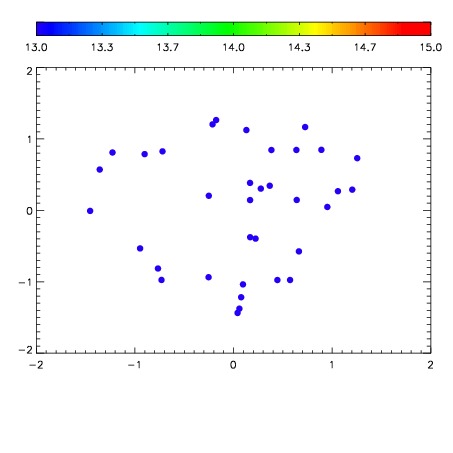

| Frame | Nreads | Zeropoints | Mag plots | Spatial mag deviation | Spatial sky 16325A emission deviations (filled: sky, open: star) | Spatial sky continuum emission | Spatial sky telluric CO2 absorption deviations (filled: H < 10) | |||||||||||||||||||||||
| 0 | 0 |
|
|
|
|
|
|
| IPAIR | NAME | SHIFT | NEWSHIFT | S/N | NAME | SHIFT | NEWSHIFT | S/N |
| 0 | 07900017 | 0.469359 | 0.00000 | 18.9686 | 07900015 | 0.00116766 | 0.468191 | 18.9795 |
| 1 | 07900016 | 0.469085 | 0.000274003 | 18.9491 | 07900014 | -0.000920026 | 0.470279 | 18.9710 |
| 2 | 07900013 | 0.469351 | 8.01682e-06 | 18.9448 | 07900018 | 0.00223384 | 0.467125 | 18.9565 |
| 3 | 07900012 | 0.467986 | 0.00137302 | 18.8845 | 07900011 | 0.00000 | 0.469359 | 18.9442 |