| Red | Green | Blue | |
| z | 17.64 | ||
| znorm | Inf | ||
| sky | -Inf | -NaN | -NaN |
| S/N | 22.0 | 40.4 | 41.7 |
| S/N(c) | 0.0 | 0.0 | 0.0 |
| SN(E/C) |
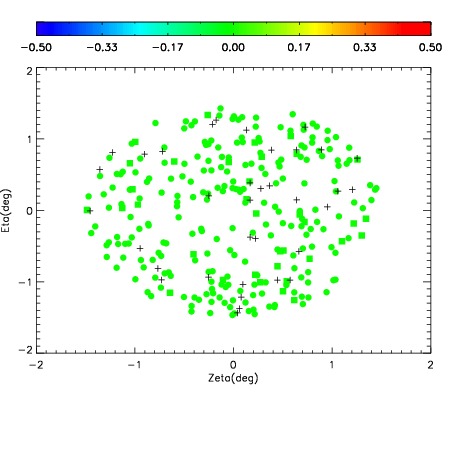
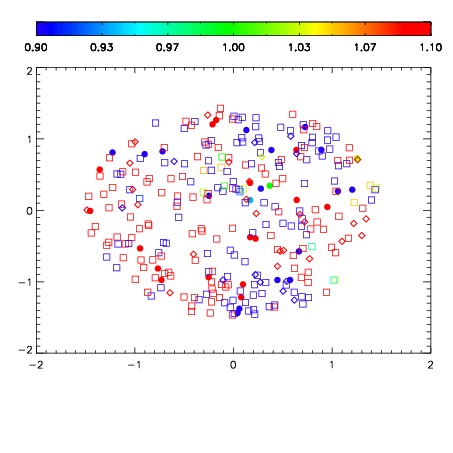
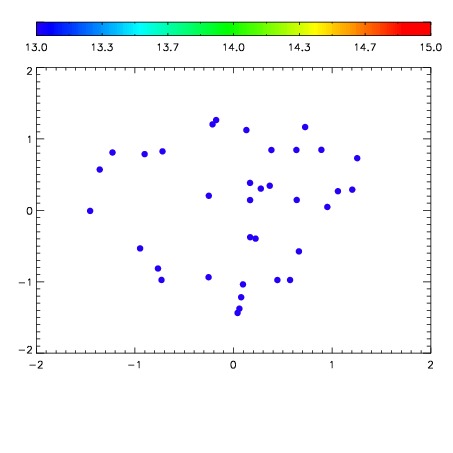

| Frame | Nreads | Zeropoints | Mag plots | Spatial mag deviation | Spatial sky 16325A emission deviations (filled: sky, open: star) | Spatial sky continuum emission | Spatial sky telluric CO2 absorption deviations (filled: H < 10) | |||||||||||||||||||||||
| 0 | 0 |
|
|
|
|
|
|
| IPAIR | NAME | SHIFT | NEWSHIFT | S/N | NAME | SHIFT | NEWSHIFT | S/N |
| 0 | 10610052 | 0.504205 | 0.00000 | 18.5560 | 10610050 | 0.00000 | 0.504205 | 18.6115 |
| 1 | 10610051 | 0.503866 | 0.000338972 | 18.5770 | 10610058 | 0.00149960 | 0.502705 | 18.6236 |
| 2 | 10610059 | 0.503045 | 0.00115997 | 18.5422 | 10610053 | 0.00162466 | 0.502580 | 18.5806 |
| 3 | 10610060 | 0.502738 | 0.00146699 | 18.5204 | 10610057 | 0.00206339 | 0.502142 | 18.5761 |
| 4 | 10610056 | 0.504139 | 6.59823e-05 | 18.2972 | 10610061 | 4.44718e-05 | 0.504161 | 18.5220 |
| 5 | 10610055 | 0.503988 | 0.000216961 | 18.2191 | 10610054 | 0.00188138 | 0.502324 | 18.4416 |