| Red | Green | Blue | |
| z | 17.64 | ||
| znorm | Inf | ||
| sky | -Inf | -NaN | -Inf |
| S/N | 28.5 | 48.0 | 51.5 |
| S/N(c) | 0.0 | 0.0 | 0.0 |
| SN(E/C) |
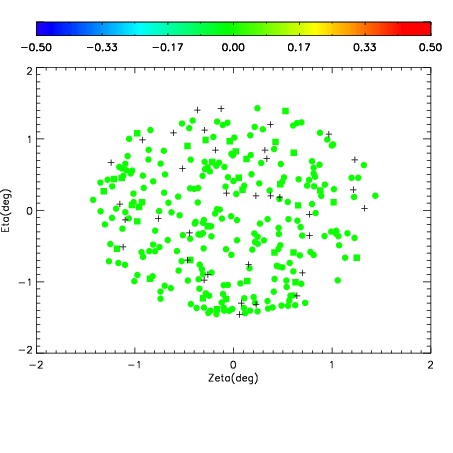
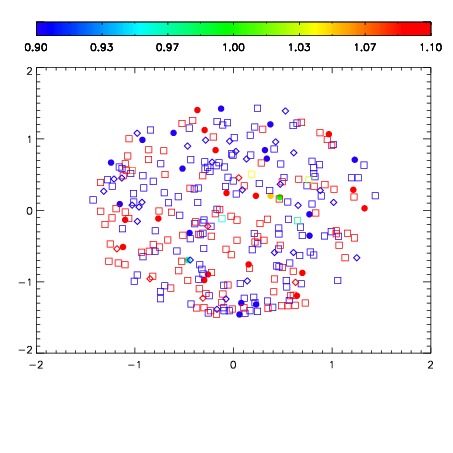


| Frame | Nreads | Zeropoints | Mag plots | Spatial mag deviation | Spatial sky 16325A emission deviations (filled: sky, open: star) | Spatial sky continuum emission | Spatial sky telluric CO2 absorption deviations (filled: H < 10) | |||||||||||||||||||||||
| 0 | 0 |
|
|
|
|
|
|
| IPAIR | NAME | SHIFT | NEWSHIFT | S/N | NAME | SHIFT | NEWSHIFT | S/N |
| 0 | 06980061 | 0.482165 | 0.00000 | 19.1322 | 06980062 | 0.000841724 | 0.481323 | 19.1404 |
| 1 | 06980065 | 0.480254 | 0.00191101 | 19.1581 | 06980066 | -0.000721783 | 0.482887 | 19.1733 |
| 2 | 06980064 | 0.479897 | 0.00226802 | 19.1430 | 06980063 | 0.000325715 | 0.481839 | 19.1561 |
| 3 | 06980060 | 0.480798 | 0.00136700 | 19.1147 | 06980059 | 0.00000 | 0.482165 | 19.0920 |