| Red | Green | Blue | |
| z | 17.63 | ||
| znorm | Inf | ||
| sky | -NaN | -NaN | -NaN |
| S/N | 24.4 | 42.9 | 45.5 |
| S/N(c) | 0.0 | 0.0 | 0.0 |
| SN(E/C) |
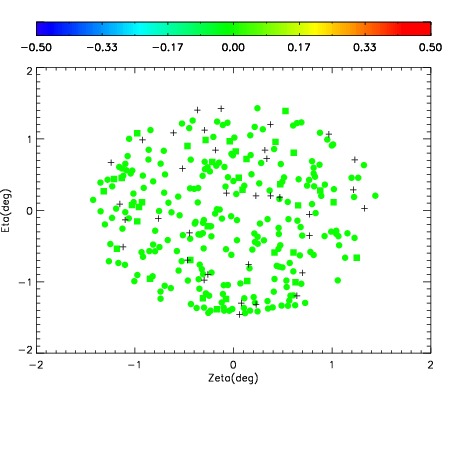
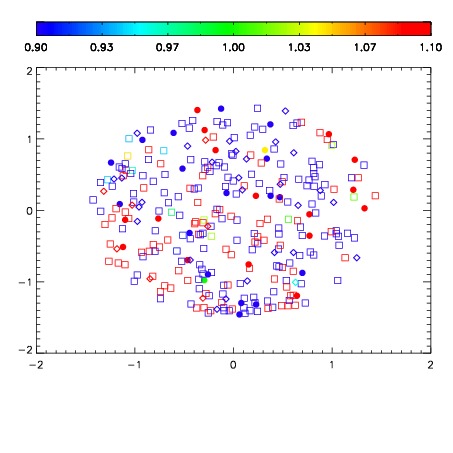


| Frame | Nreads | Zeropoints | Mag plots | Spatial mag deviation | Spatial sky 16325A emission deviations (filled: sky, open: star) | Spatial sky continuum emission | Spatial sky telluric CO2 absorption deviations (filled: H < 10) | |||||||||||||||||||||||
| 0 | 0 |
|
|
|
|
|
|
| IPAIR | NAME | SHIFT | NEWSHIFT | S/N | NAME | SHIFT | NEWSHIFT | S/N |
| 0 | 07030027 | 0.470241 | 0.00000 | 18.9220 | 07030028 | -0.000235412 | 0.470476 | 18.9119 |
| 1 | 07030030 | 0.468420 | 0.00182101 | 18.9331 | 07030032 | 0.000191724 | 0.470049 | 18.9642 |
| 2 | 07030031 | 0.468805 | 0.00143602 | 18.9310 | 07030029 | -0.000445352 | 0.470686 | 18.9404 |
| 3 | 07030026 | 0.468985 | 0.00125602 | 18.8476 | 07030025 | 0.00000 | 0.470241 | 18.8758 |