| Red | Green | Blue | |
| z | 17.64 | ||
| znorm | Inf | ||
| sky | -NaN | -NaN | -NaN |
| S/N | 27.7 | 46.8 | 48.8 |
| S/N(c) | 0.0 | 0.0 | 0.0 |
| SN(E/C) |
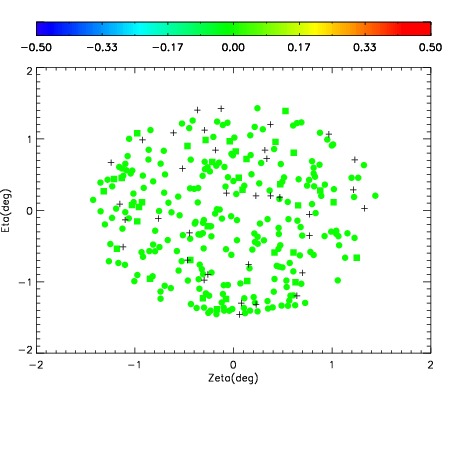
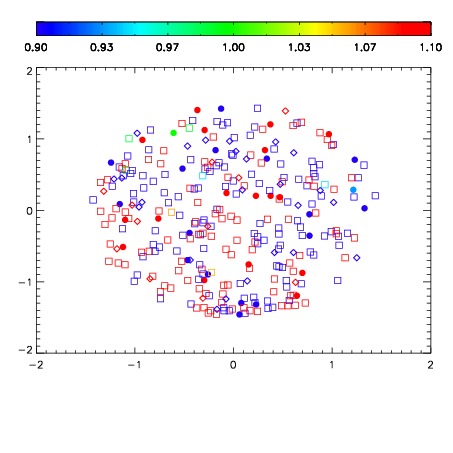


| Frame | Nreads | Zeropoints | Mag plots | Spatial mag deviation | Spatial sky 16325A emission deviations (filled: sky, open: star) | Spatial sky continuum emission | Spatial sky telluric CO2 absorption deviations (filled: H < 10) | |||||||||||||||||||||||
| 0 | 0 |
|
|
|
|
|
|
| IPAIR | NAME | SHIFT | NEWSHIFT | S/N | NAME | SHIFT | NEWSHIFT | S/N |
| 0 | 10210091 | 0.490923 | 0.00000 | 19.1691 | 10210092 | 0.00254940 | 0.488374 | 19.1694 |
| 1 | 10210090 | 0.489718 | 0.00120500 | 19.1445 | 10210089 | 0.00289005 | 0.488033 | 19.1477 |
| 2 | 10210087 | 0.489112 | 0.00181100 | 19.1174 | 10210088 | 0.00291295 | 0.488010 | 19.1327 |
| 3 | 10210086 | 0.488936 | 0.00198698 | 19.0828 | 10210085 | 0.00000 | 0.490923 | 19.0552 |