| Red | Green | Blue | |
| z | 17.64 | ||
| znorm | Inf | ||
| sky | -Inf | -Inf | -Inf |
| S/N | 21.9 | 38.4 | 39.1 |
| S/N(c) | 0.0 | 0.0 | 0.0 |
| SN(E/C) |
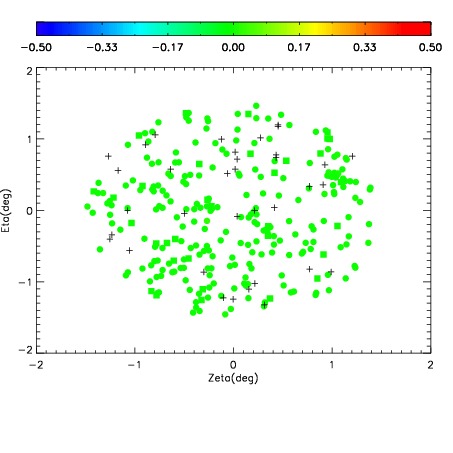
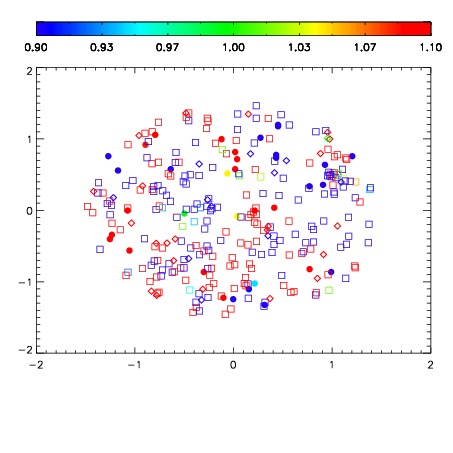
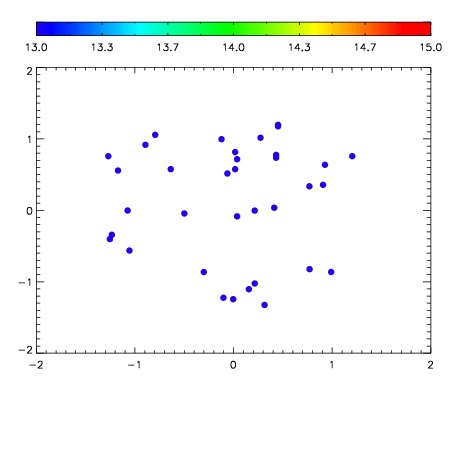

| Frame | Nreads | Zeropoints | Mag plots | Spatial mag deviation | Spatial sky 16325A emission deviations (filled: sky, open: star) | Spatial sky continuum emission | Spatial sky telluric CO2 absorption deviations (filled: H < 10) | |||||||||||||||||||||||
| 0 | 0 |
|
|
|
|
|
|
| IPAIR | NAME | SHIFT | NEWSHIFT | S/N | NAME | SHIFT | NEWSHIFT | S/N |
| 0 | 10810056 | 0.487073 | 0.00000 | 18.6586 | 10810057 | 0.00110759 | 0.485965 | 18.5494 |
| 1 | 10810051 | 0.485686 | 0.00138700 | 18.8552 | 10810050 | 0.00000 | 0.487073 | 18.8343 |
| 2 | 10810052 | 0.486795 | 0.000277996 | 18.8043 | 10810054 | 0.00151429 | 0.485559 | 18.7980 |
| 3 | 10810055 | 0.486377 | 0.000696003 | 18.7189 | 10810053 | 0.00117549 | 0.485898 | 18.7520 |