| Red | Green | Blue | |
| z | 17.64 | ||
| znorm | Inf | ||
| sky | -NaN | -NaN | -Inf |
| S/N | 16.7 | 31.4 | 32.5 |
| S/N(c) | 0.0 | 0.0 | 0.0 |
| SN(E/C) |
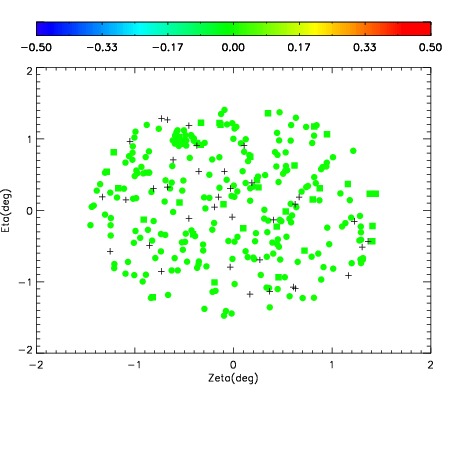
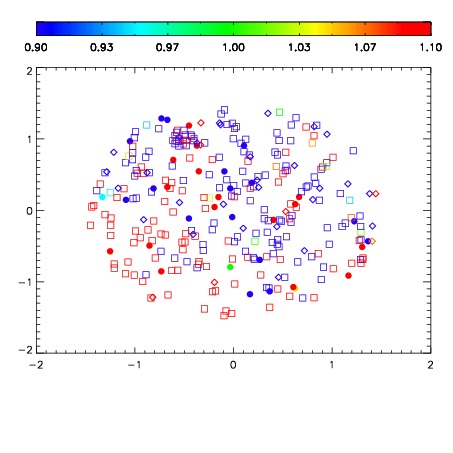
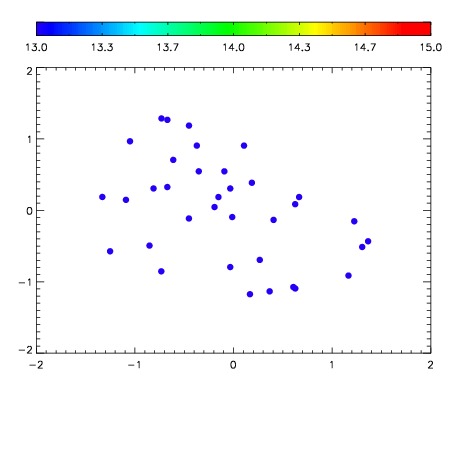

| Frame | Nreads | Zeropoints | Mag plots | Spatial mag deviation | Spatial sky 16325A emission deviations (filled: sky, open: star) | Spatial sky continuum emission | Spatial sky telluric CO2 absorption deviations (filled: H < 10) | |||||||||||||||||||||||
| 0 | 0 |
|
|
|
|
|
|
| IPAIR | NAME | SHIFT | NEWSHIFT | S/N | NAME | SHIFT | NEWSHIFT | S/N |
| 0 | 07050017 | 0.470365 | 0.00000 | 18.2150 | 07050015 | 0.00483979 | 0.465525 | 18.1462 |
| 1 | 07050012 | 0.468354 | 0.00201100 | 18.4867 | 07050011 | 0.00000 | 0.470365 | 18.5010 |
| 2 | 07050013 | 0.469515 | 0.000849992 | 18.3986 | 07050014 | 0.00304174 | 0.467323 | 18.2742 |
| 3 | 07050016 | 0.469563 | 0.000801980 | 18.3404 | 07050018 | 0.00278239 | 0.467583 | 18.2122 |