| Red | Green | Blue | |
| z | 17.64 | ||
| znorm | Inf | ||
| sky | -Inf | -NaN | -Inf |
| S/N | 25.9 | 44.1 | 45.9 |
| S/N(c) | 0.0 | 0.0 | 0.0 |
| SN(E/C) |
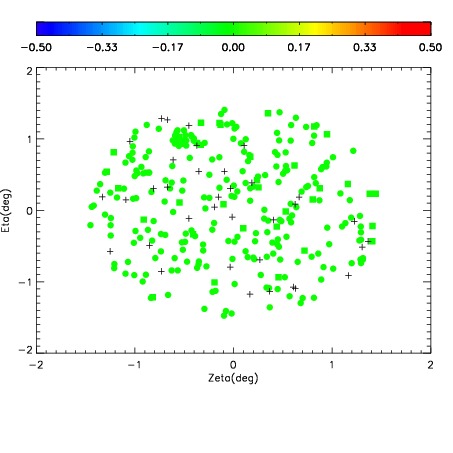
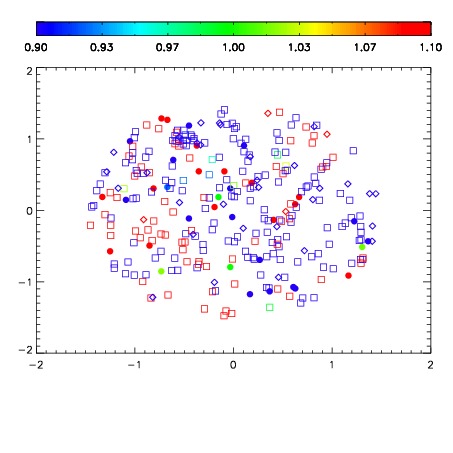
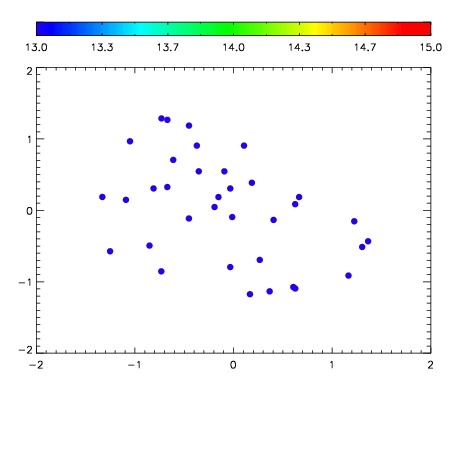

| Frame | Nreads | Zeropoints | Mag plots | Spatial mag deviation | Spatial sky 16325A emission deviations (filled: sky, open: star) | Spatial sky continuum emission | Spatial sky telluric CO2 absorption deviations (filled: H < 10) | |||||||||||||||||||||||
| 0 | 0 |
|
|
|
|
|
|
| IPAIR | NAME | SHIFT | NEWSHIFT | S/N | NAME | SHIFT | NEWSHIFT | S/N |
| 0 | 07280050 | 0.488454 | 0.00000 | 18.9580 | 07280052 | 0.00169805 | 0.486756 | 18.8768 |
| 1 | 07280049 | 0.487947 | 0.000507027 | 18.9687 | 07280048 | 0.00000 | 0.488454 | 18.8880 |
| 2 | 07280054 | 0.486923 | 0.00153100 | 18.9480 | 07280055 | 0.00472338 | 0.483731 | 18.8243 |
| 3 | 07280053 | 0.486131 | 0.00232300 | 18.9092 | 07280051 | 0.00190906 | 0.486545 | 18.7995 |