| Red | Green | Blue | |
| z | 17.64 | ||
| znorm | Inf | ||
| sky | -Inf | -Inf | -NaN |
| S/N | 24.6 | 43.4 | 46.5 |
| S/N(c) | 0.0 | 0.0 | 0.0 |
| SN(E/C) |
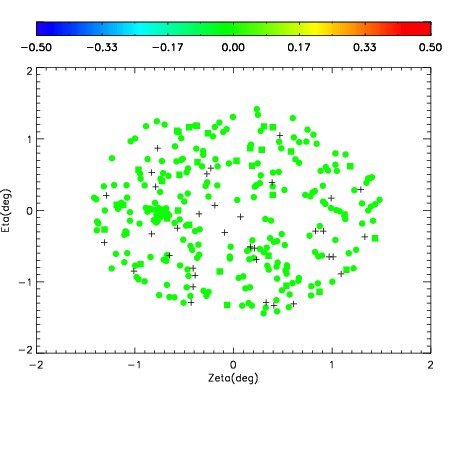
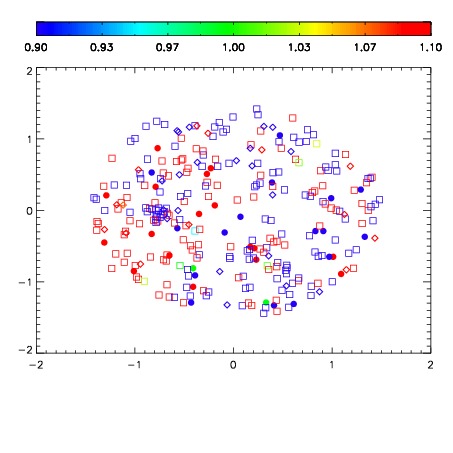
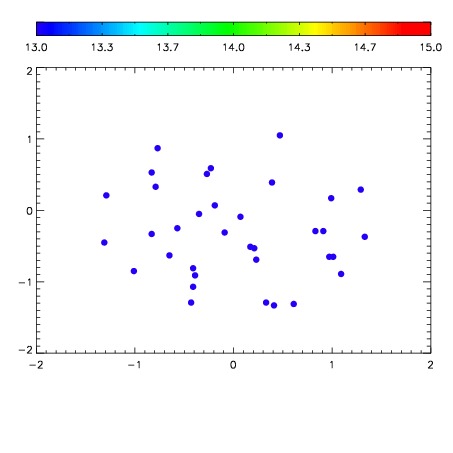

| Frame | Nreads | Zeropoints | Mag plots | Spatial mag deviation | Spatial sky 16325A emission deviations (filled: sky, open: star) | Spatial sky continuum emission | Spatial sky telluric CO2 absorption deviations (filled: H < 10) | |||||||||||||||||||||||
| 0 | 0 |
|
|
|
|
|
|
| IPAIR | NAME | SHIFT | NEWSHIFT | S/N | NAME | SHIFT | NEWSHIFT | S/N |
| 0 | 11150028 | 0.480903 | 0.00000 | 18.9322 | 11150026 | -0.00315050 | 0.484053 | 18.9219 |
| 1 | 11150027 | 0.480097 | 0.000806004 | 18.9651 | 11150029 | -0.00186498 | 0.482768 | 18.9509 |
| 2 | 11150024 | 0.480277 | 0.000625998 | 18.8280 | 11150025 | -0.00347617 | 0.484379 | 18.8540 |
| 3 | 11150023 | 0.479298 | 0.00160500 | 18.8112 | 11150022 | 0.00000 | 0.480903 | 18.6279 |